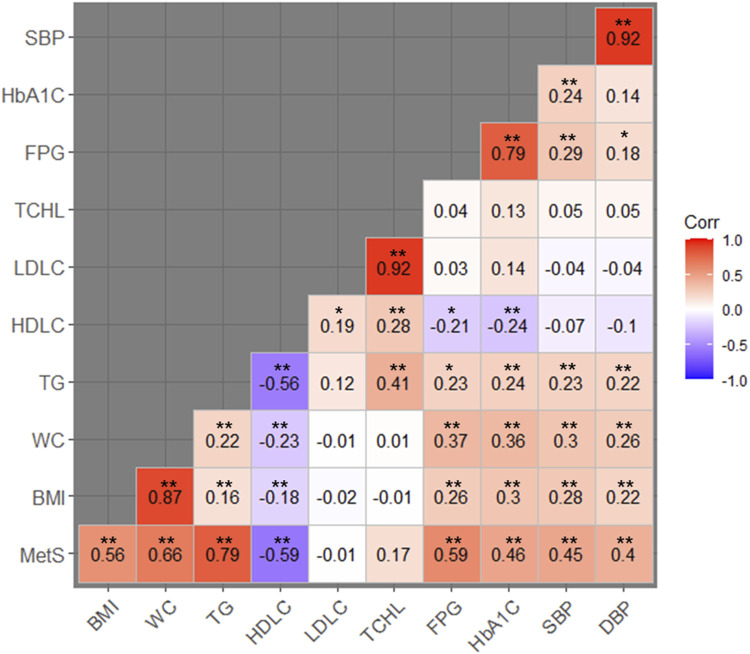
FIGURE 2.
Heat map of the genetic correlation between MetS and its related traits. Red-colored boxes represent positive genetic correlations while blue-colored boxes represent negative correlations. Numbers in the boxes indicate the genetic correlation coefficients between the traits being compared. *Genetic correlations with P-values less than 0.05; **genetic correlations with P-values less than 0.01.

