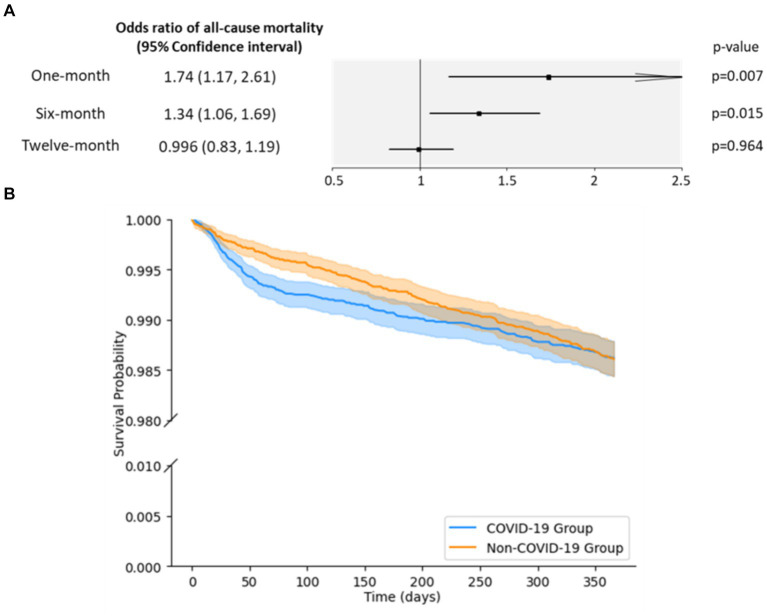
Figure 2.
Odds ratio (OR) and survival probabilities for all-cause mortality. (A) ORs of all-cause mortality by period. An OR greater than one indicates a higher risk of all-cause mortality in the COVID-19 group than in the non-COVID-19 group. (B) Kaplan–Meier survival curves for all-cause mortality. The curves represent the survival probabilities in days for the COVID-19 group (blue) and the non-COVID-19 group (orange). The shaded regions correspond to the lower and upper 95% confidence bounds.

