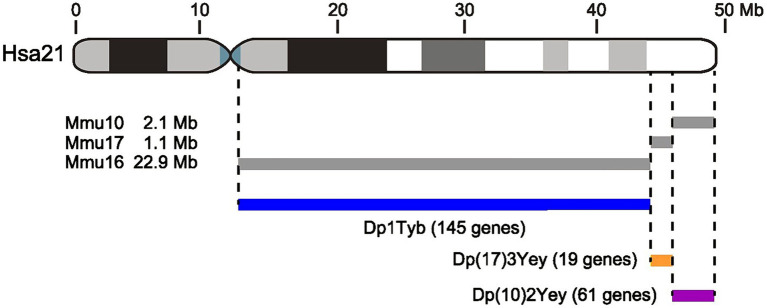
Figure 1.
Schematic of Hsa21 and the three mouse models used in this study. Diagram of Hsa21 at the top showing short and long arms and the centromere (blue). Gray and black boxes indicate cytogenetic bands. Length of the chromosome is indicated in Mb. Gray lines below Hsa21 indicate regions of orthology on Mmu16, Mmu17, and Mmu10 and their DNA lengths. Note that the short arm of Hsa21 contains largely repetitive DNA and does not have known orthology to the mouse genome. The three mouse models, Dp1Tyb, Dp(17)3Yey, and Dp(10)2Yey have an extra copy of each of these three Hsa21-orthologous regions of the mouse genome. Numbers of protein coding genes are indicated in parentheses, and were calculated as described in the Methods.

