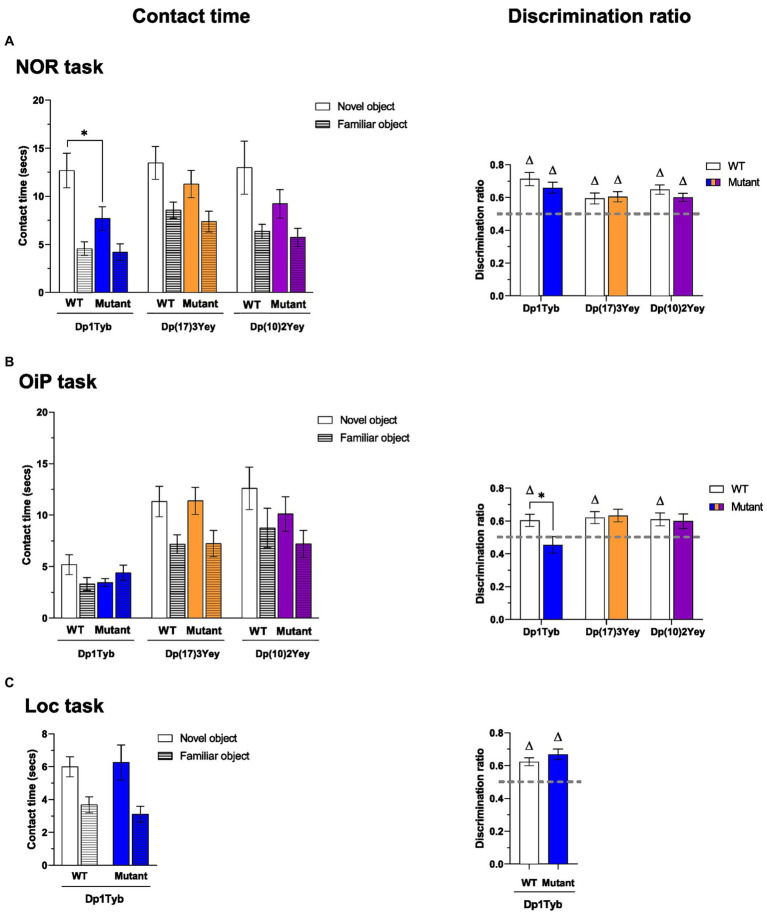
Figure 4.
Performance of 12-13-month-old Dp1Tyb, Dp(17)3Yey and Dp(10)2Yey male mice in recognition memory tasks. (A–C) Mean ± SEM contact times per single object (left) and discrimination ratios (right) of 12–13 month-old Dp1Tyb, Dp(17)3Yey and Dp(10)2Yey mice and WT controls during the test phase of the recognition memory tasks. In the NOR task (A), the test phase comprised a total of one novel and two familiar objects. In the OiP task (B), the test phase comprised a total of two objects with a novel OiP association and one object with a familiar OiP association. In the Loc task (C), the test comprised a total of one object in a novel location and two identical, stationary objects. Discrimination ratios above 0.5 (gray horizontal lines) indicate above chance preference for novelty (one sample t-test, ∆p < 0.05). Compared to WT littermates, Dp1Tyb mice spent less time with the novel object in the NOR task (two-way ANOVA, *p < 0.05) (A) and showed a lower discrimination ratio in the OiP task (Student’s t-test, *p < 0.05) (B). For NOR and OiP task: Dp1Tyb: n = 11 WT, 12 Dp1Tyb; Dp(17)3Yey: n = 12 WT, 12 Dp(17)3Yey; Dp(10)2Yey: n = 12 WT, 12 Dp(10)2Yey. For Loc task: Dp1Tyb: n = 11 WT, 11 Dp1Tyb.

