FIGURE 3.
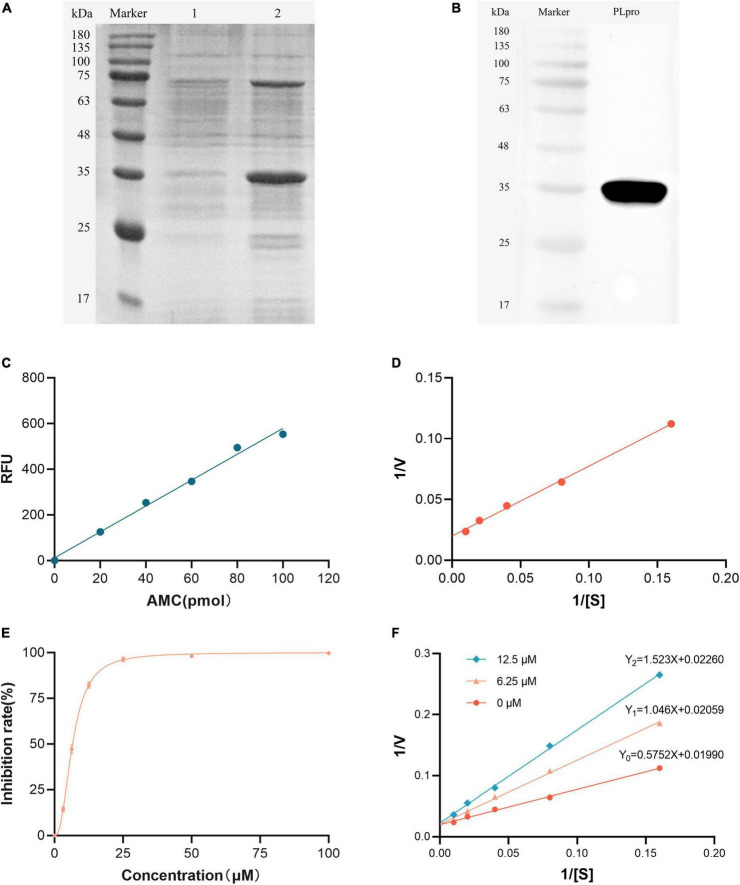
Inhibition of TGEV PLpro deubiquitinating activity by myricetin. (A) SDS-PAGE analysis of E. coli BL21 cells transformed with pET-32a-PLpro. Lane 1 represents uninduced cells while lane 2 represents induced cells. (B) Western blot of the purified TGEV PLspro protein using anti-His tag antibody. (C) AMC standard curve. The fluorescence intensity (Y) had a linear relationship with the AMC content (X) (Y = 5.8328X). (D) Double reciprocal plot for the detection of TGEV PLpro activity. The initial enzyme velocity (V) was inversely proportional to the substrate concentration ([S]) according to the Michaelis-Menten equation. The slope and intercept of the plot were utilized to compute the enzyme-substrate affinity (Km) and the maximum enzyme reaction velocity (Vmax). (E) Inhibition rate of myricetin at different concentrations on PLpro deubiquitinating enzyme activity. Myricetin inhibited TGEV PLpro activity in a dose-dependent manner, with an IC50 of 6.563 μM. (F) Double reciprocal plot for the inhibition of TGEV PLpro by different concentrations of myricetin. Myricetin increased the Km of TGEV PLpro without affecting the Vmax, indicating a competitive inhibition mode.

