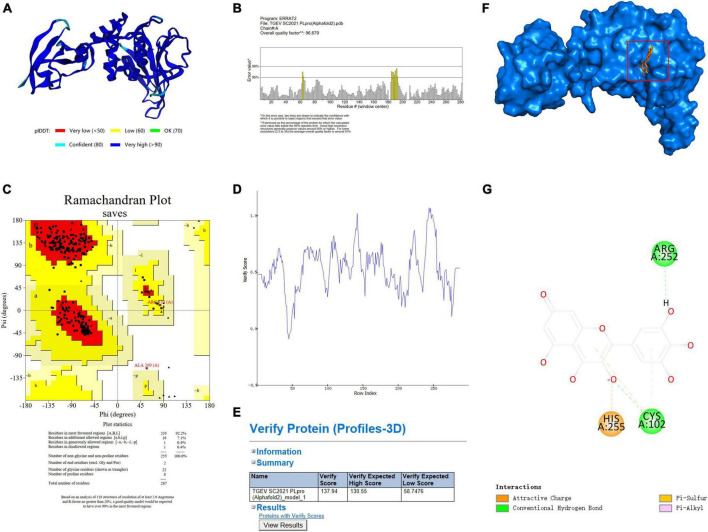
FIGURE 4.
TGEV PLpro three-dimensional model establishment and analysis. (A) The 3D structure of PLpro has been determined by using Alphafold2. (B) The Errat2 model is used to calculate scores for amino acid residues. (C) Ramachandran plots show regions permitted for the homologous mode of PLpro. The regions are color-coded; Red (best), Yellow (appropriate), Light yellow (barely permitted), and White (disallowed). (D,E) 3D plot profile for the PLpro protein structure. (F) Ligand docking model of PLpro from TGEV SC2021 and myricetin. The blue surface represents the crystal structure of PLpro from TGEV while the orange stick model represents myricetin. (G) The 2D interactions between myricetin and PLpro involve orange dotted lines (attractive charge), light orange dotted lines (Pi-sulfur), green dotted lines (conventional hydrogen bond), and pink dotted lines (Pi-alkyl).

