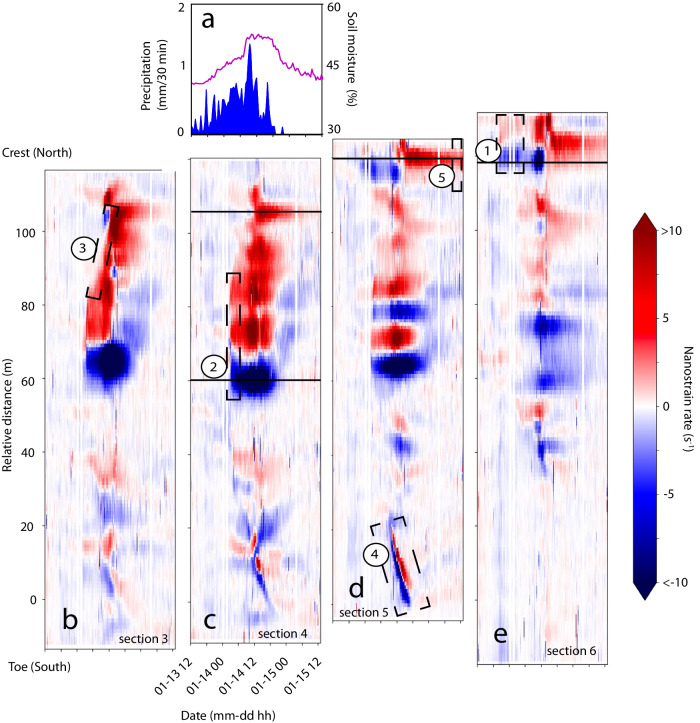
Fig. 2. Strain-rate spatiotemporal images.
Strain-rate image positions are adjusted for similar latitude (y-axis) across all four easternmost cable sections (cable sections are shown from west to east, sections are numbered as 3 through 6) from as-built survey of cable. a Precipitation (blue) and soil moisture (purple) data. b Strain-rate for cable section 3, highlighting Sequence 3. c Strain-rate for cable section 4, highlighting Sequence 2 and DAS channel locations featured in Fig.4c (lower solid line) and Fig.4d (upper solid line). d Strain-rate for cable section 5, highlighting Sequences 4 and 5, and DAS channel location featured in Fig. 4e. e Strain-rate for cable section 6, highlighting Sequence 1 and DAS channel location featured in Fig. 4b.

