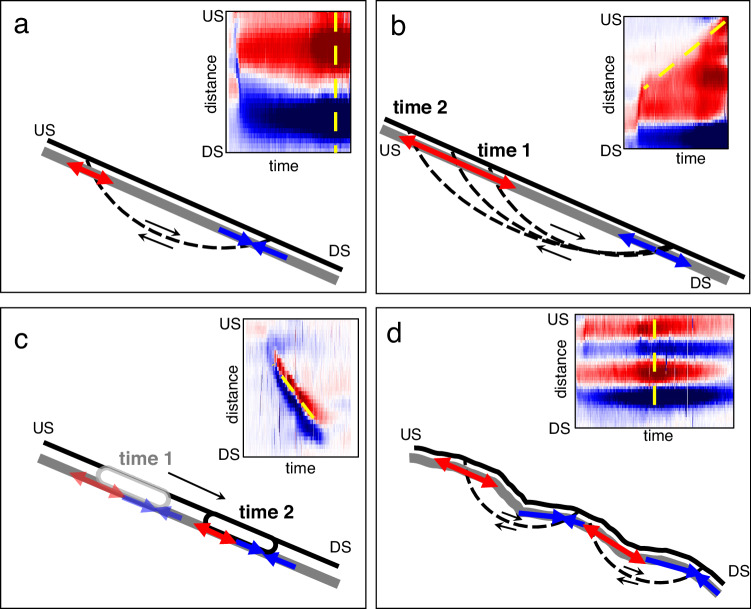
Fig. 3. Conceptual framework to support interpretation of strain-rate patterns.
Inset figures represent strain-rate spatiotemporal images selected over select channels and time periods to illustrate key patterns. Fiber optic cable is shown in gray. The red and blue arrows represent extensional and compressional strain-rate observations, respectively. US upslope, DS downslope. The dotted yellow line demonstrates whether inferences are made over a single time period along a series of channels or over multiple time periods along a series of channels. a Inferred slip surface. b Inferred retrogression. c Inferred flow lobe surge. d Inferred slip surfaces due to topographic variations.

