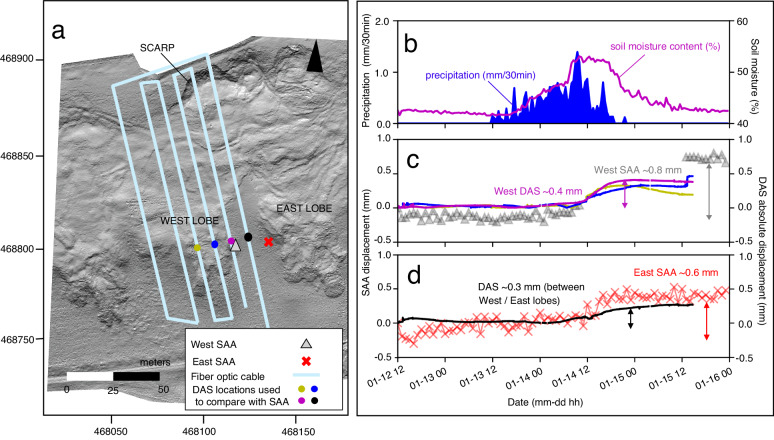
Fig. 6. Comparison of ShapeArray displacements with DAS-derived displacements.
a Overview figure indicating the approximate locations of DAS channels selected for comparison alongside the location of the two ShapeArrays (SAA), depicted as a gray triangle and red cross on the west and east lobes, respectively. The west lobe ShapeArray did not record data from January 14 at 11:00 to January 15 at 13:00 for reasons unknown. Lidar bare-earth imagery data were acquired in November 2020. Grid coordinates per the British Grid OSGB36 datum. b Precipitation and soil moisture data. c Time displacement plot comparing the DAS-derived displacements with the west lobe ShapeArray displacements. d Time displacement plot comparing the DAS-derived displacements with the east lobe ShapeArray displacements.

