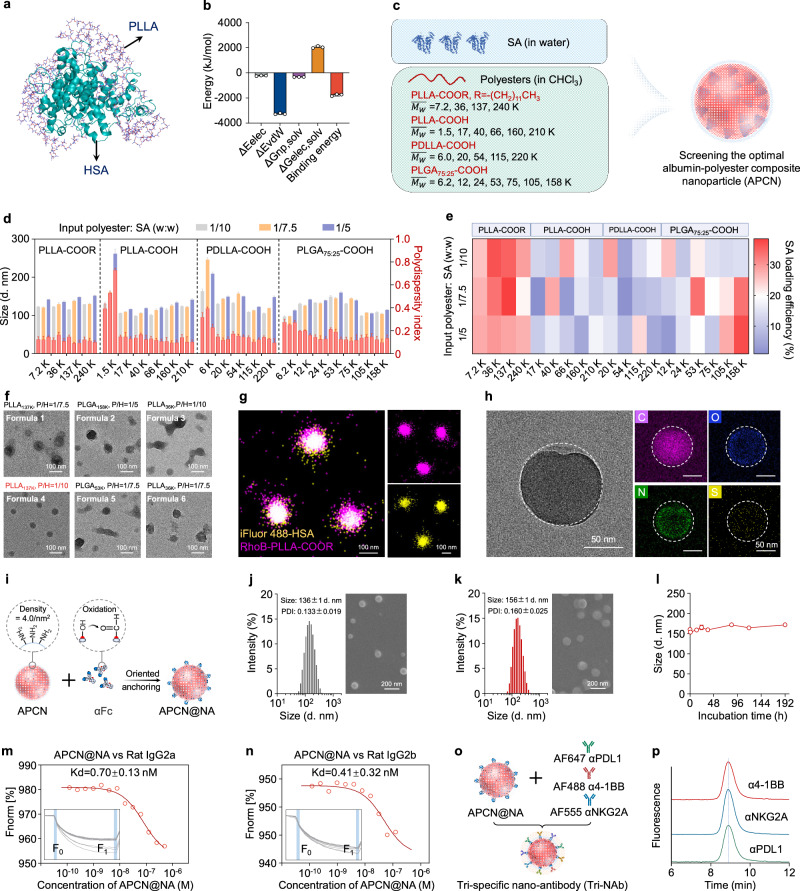
Fig. 2. Construction and characterization of APCN and Tri-NAb.
a Molecular dynamics simulation pattern. b Binding free energy and individual energy terms. Data are presented as means ± s.d. (n = 3 independent calculation). c Scheme of the category and molecular weight () of polyesters for screening the optimal formula. d Average hydrodynamic size and PDI of NPs prepared using different formulas as determined by DLS. Data are presented as means ± s.d. (n = 5 biologically independent samples). e HPLC analysis of the SA-loading efficiency of NPs prepared using different formulations. f Representative TEM images of NPs prepared with the top six formulations with the highest SA loading efficiency. P/H is the weight ratio of polyester to HSA. g STORM images of APCN. HSA and PLLA were labeled with iFluor 488 and RhoB, respectively. h Representative TEM image and EDS elemental map (C, N, O, and S) of APCN. i Scheme of the construction of APCN@NA. αFc was oxidized and immobilized onto HSA contained in APCN through an aldehyde–amine reaction. Size distribution and representative SEM images of APCN (j) and APCN@NA (k). Data are presented as means ± s.d. (n = 6 biologically independent samples). l Size variation of APCN@NA in PBS during incubation for eight days. Data are presented as means ± s.d. (n = 5 biologically independent samples). m, n MST spectra indicating that APCN@NA has a similar affinity for rat IgG2a and IgG2b, namely, the three selected antibodies (αPDL1, α4-1BB, and αNKG2A). o Scheme of the construction of the Tri-NAb through gentle mixing of APCN@NA and the three antibodies (αPDL1, α4-1BB, and αNKG2A). p HPLC-FLR confirmed that the three antibodies were immobilized on the Tri-NAb. Source data are provided as a Source Data file.

