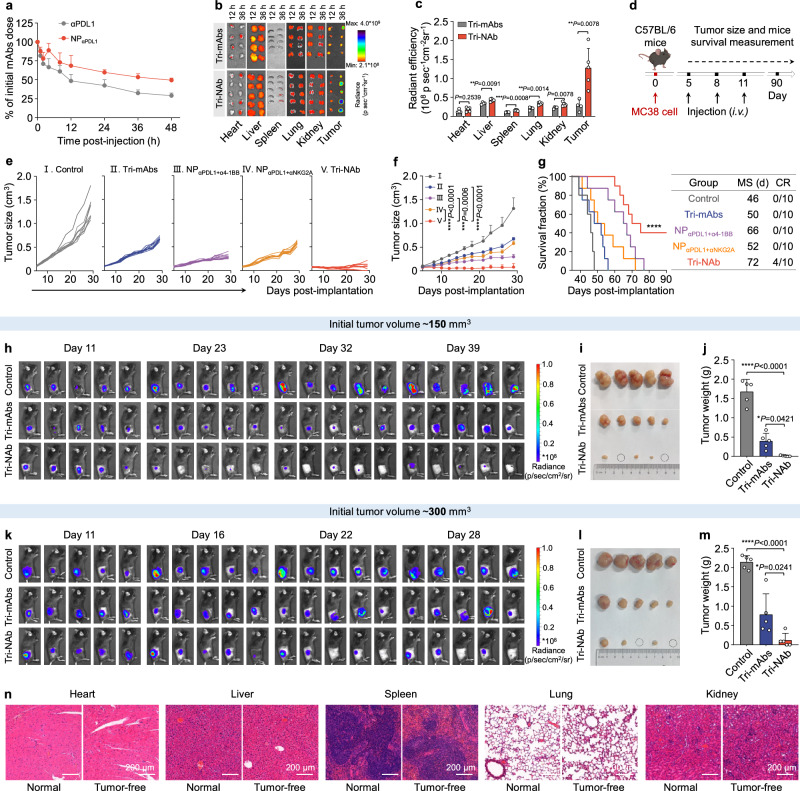
Fig. 4. Tri-NAb effectively eradicated murine colon cancer in vivo.
a Blood circulation half-life of αPDL1 and NPαPDL1 evaluated in female C57BL/6 mice using Cy5-labeled αPDL1. b Ex vivo fluorescence imaging. Major organs and tumor tissues of female C57BL/6 mice were collected for ex vivo imaging at 12 and 36 h after the i.v. injection of Cy5-labeled Tri-mAbs or Tri-NAb. c Fluorescence quantification of Cy5-labeled Tri-mAbs (represented by gray bars) or Tri-NAb (represented by orange bars) in organs and tumor tissues. The Tri-mAbs data are presented as means ± s.d. (n = 4 biologically independent mice). The Tri-NAb data are presented as means ± s.d. (n = 5 biologically independent mice). Statistical significance was calculated using two-way ANOVA followed by the Bonferroni test. *P < 0.05; **P < 0.01. d Experimental scheme of the subcutaneous MC38 murine colon cancer model in female C57BL/6 mice. Different formulations with equivalent doses of αPDL1, α4-1BB, and αNKG2A (2.5 mg/kg each) were i.v. administered via the tail vein on Days 5, 8, and 11 after MC38 tumor cell inoculation. Individual (e) and average (f) tumor growth curves of MC38 tumors in animals treated with different formulations. Data are presented as means ± s.d. (n = 10 mice per group). g Survival curves for each group of mice. MS, median survival time. CR, complete response. Data are presented as means ± s.d. (n = 10 mice per group). In vivo bioluminescence imaging showed the therapeutic effect of Tri-mAbs or Tri-NAb on the MC38-luc tumor model in female C57BL/6 mice with an initial volume of 150 (h) or 300 mm3 (k). The equivalent injection doses of αPDL1, α4-1BB, and αNKG2A were 2.5 mg/kg. i–l Tumor images collected from treatment endpoints. The solid black circles indicate tumor-free tissues after treatment. j, m Tumor weights after different treatments. Data are presented as means ± s.d. (n = 5 mice per group). n Representative images of H&E staining of major organs in normal and tumor-free mice 2 months after the end of (d) treatment. For g statistical significance was calculated using the log-rank (Mantel-Cox) test. For c, j, and m, statistical significance was calculated using one-way ANOVA with Tukey’s post hoc test. *P < 0.05; **P < 0.01; ***P < 0.001; and ****P < 0.0001. Figure 4d was created with BioRender.com under a CC-BY-NC-ND license. Source data are provided as a Source Data file.

