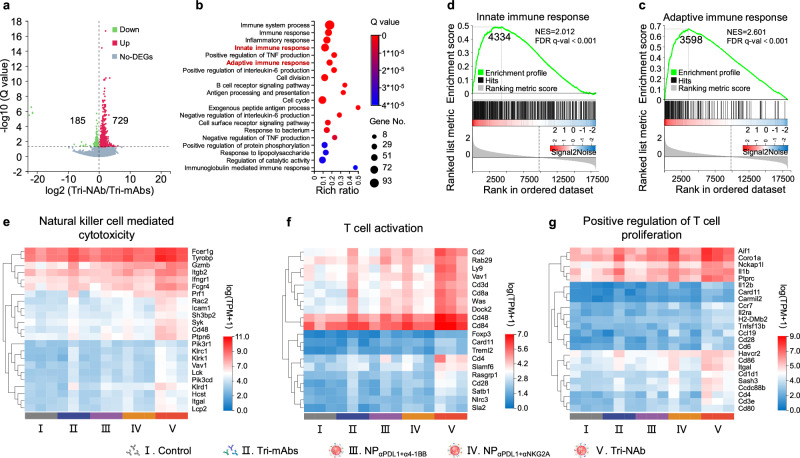
Fig. 5. Transcriptomic analysis.
a Volcano plot displaying the distributions of upregulated (729) and downregulated genes (185) ( ≥ 2-fold difference, Q value < 0.05) in the Tri-NAb group compared to the Tri-mAbs group. DEGs, differentially expressed genes; non-DEGs, non-differentially expressed genes. b Gene Ontology (GO) analysis of biological process annotations of DEGs in (a) the Tri-NAb group indicating that the DEGs were mainly involved in immune pathways, including innate and adaptive immune responses. Gene set enrichment analysis (GSEA) of DEGs enriched in innate (c) and adaptive immune response pathways (d) after treatment with Tri-NAb. The green line indicates the gene enrichment score (ES) change curve. Each black vertical line represents one gene, and genes enriched in either condition are shown at the left (Tri-NAb) or right (Tri-mAbs) parts of the graph. NES, normalized enrichment score. FDR q-val, false discovery rate q-value. Heatmaps of different groups of upregulated DEGs related to NK-cell-mediated cytotoxicity (e) T-cell activation (f) and positive regulation of T-cell proliferation (g) pathways. Source data are provided as a Source Data file.

