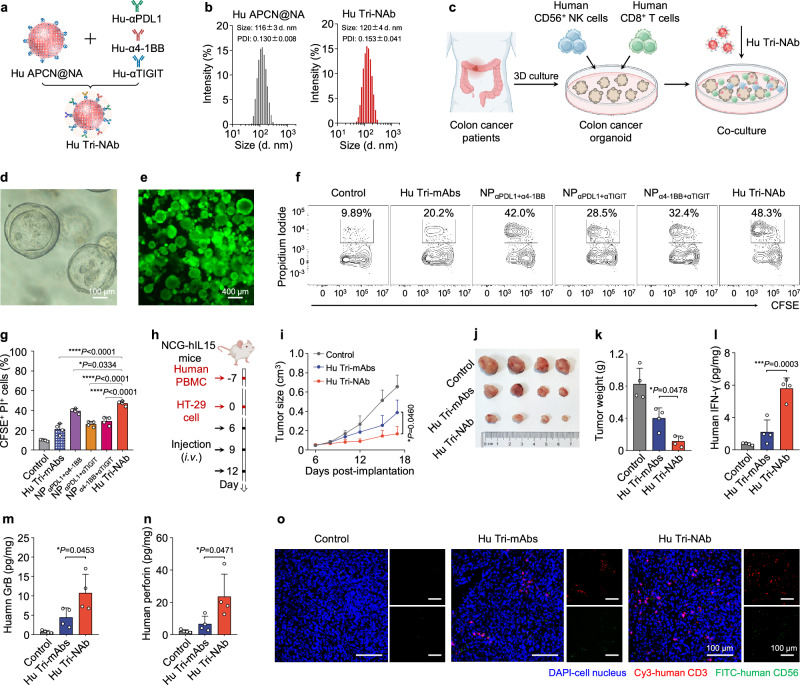
Fig. 7. Hu Tri-NAb exhibited potent killing activity on patient-derived colon cancer organoids and human HT-29 colorectal cancer in humanized mice.
a Scheme of the construction of Hu Tri-NAb through gentle mixing of Hu APCN@NA and Hu-αPDL1, Hu-α4-1BB, and Hu-αTIGIT. Similar to Fig. 2i., Hu APCN@NA was prepared by coupling Hu αFc on the surface of APCN. b Size distribution of Hu APCN@NAs and Hu Tri-NAb determined using DLS. c An experimental scheme illustrating the study of the cytotoxicity of human primary CD56+ NK and CD8+ T cells from human peripheral blood mononuclear cells (PBMCs) toward colon cancer organoids from patient-derived colon cancer tissues after an incubation with 1) control, 2) Hu Tri-mAbs (Hu-αPDL1 & Hu-α4-1BB & Hu-αTIGIT), 3) NPαPDL1+α4-1BB, 4) NPαPDL1+αTIGIT, 5) NPα4-1BB+αTIGIT, or 6) Hu Tri-NAb. The organoids were first labeled with CFSE, and all the cells were stained with propidium iodide (PI). The proportion of CFSE+ PI+ cells was detected using flow cytometry. d Bright-field image of colon cancer organoids. e Fluorescence image of CFSE-labeled colon cancer organoids. f Representative scatter plots of flow cytometry data and corresponding quantification results (g) showing the number of CFSE+ PI+ cells as a percentage of the total cells. Data are presented as means ± s.d. (n = 4 biologically independent samples). h Experimental scheme of the subcutaneous HT-29 human colon xenograft tumor model in female NCG-hIL15 mice. i Average tumor growth kinetics in mice treated with different formulations. Data are presented as means ± s.d. (n = 4 mice per group). j Tumor images collected from treatment endpoints. k Tumor weights after different treatments. Data are presented as means ± s.d. (n = 4 mice per group). The levels of human IFN-γ (l), human granzyme B (m), and human perforin (n) in treated HT-29 tumors were examined using ELISAs. Data are presented as the means ± s.d. (n = 4 biologically independent samples). o Representative fluorescence images of tumor lesions after staining with DAPI (blue), anti-human CD56 (FITC, green), and anti-human CD3 antibodies (Cy3, red). Statistical significance was determined using one-way ANOVA with Tukey’s post hoc test. *P < 0.05; **P < 0.01; ***P < 0.001; and ****P < 0.0001. Figures 7c and h were created with BioRender.com under a CC-BY-NC-ND license. Source data are provided as a Source Data file.

