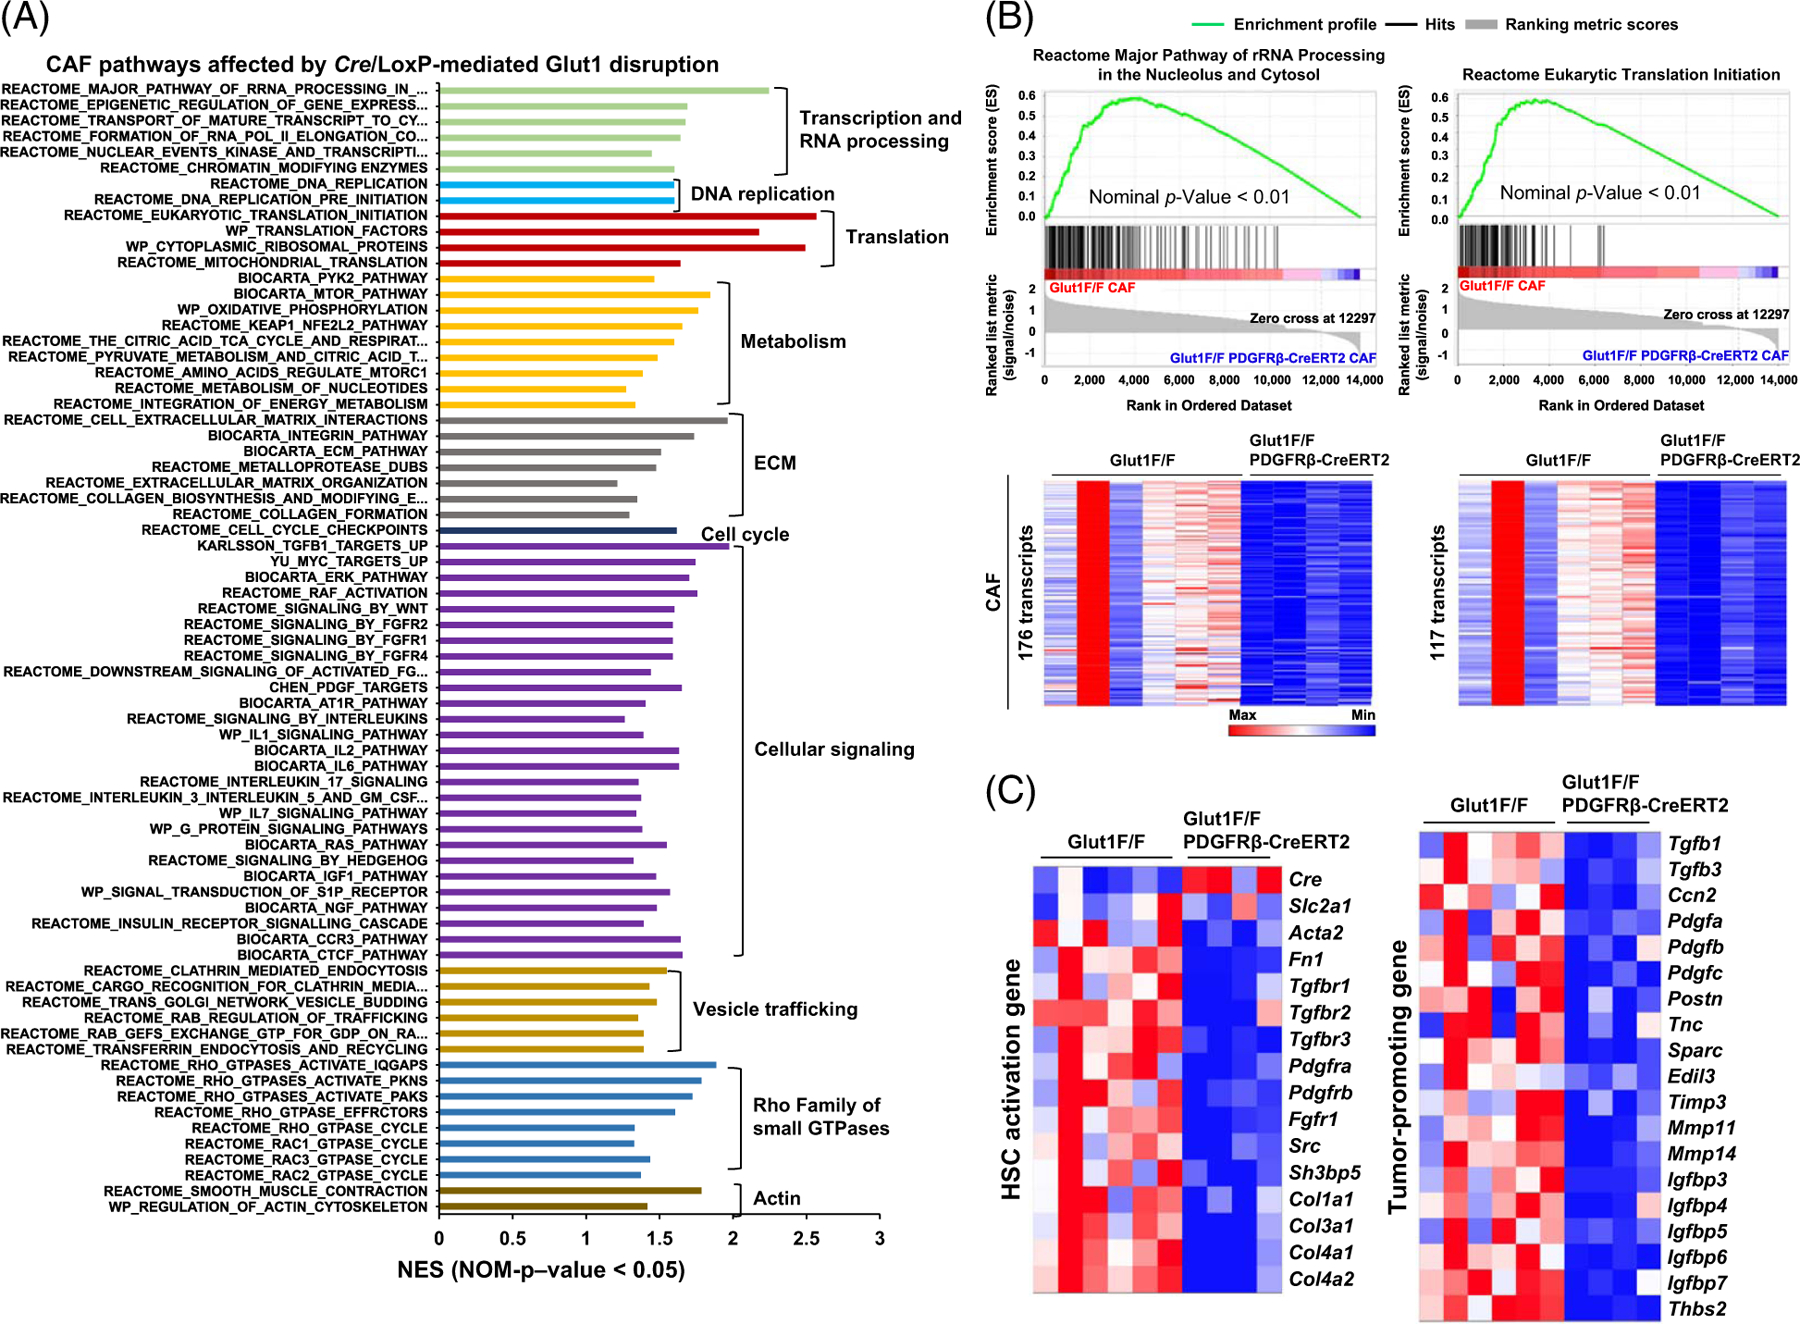
FIGURE 7.

Spatialomics revealing transcriptomic changes in Glut1-deficient CAFs of MC38 liver metastases. (A) GSEA identified altered signaling pathways and cellular processes in Glut1-deficient CAFs compared to control CAFs based on NES > 1 and p < 0.05. (B) Two gene sets with transcription affected by Cre/LoxP-mediated Glut1 gene disruption are shown. Transcript enrichment is shown by the enrichment plots (upper), and transcript levels are shown by heatmaps (lower). The scale bar represents the minimum (blue) to the maximum expression level (red). (C) Two heatmaps revealed that Glut1 deficiency suppressed transcripts of 15 HSC activation genes (left) and 19 tumor-promoting genes (right) in the CAFs. Abbreviations: CAF, cancer-associated fibroblast; Cre/LoxP, Cre recombinase/LoxP sequence derived from bacteriophage P1; Glut1, glucose transporter 1; GSEA, Gene Set Enrichment Analysis; NES, normalized enrichment score.
