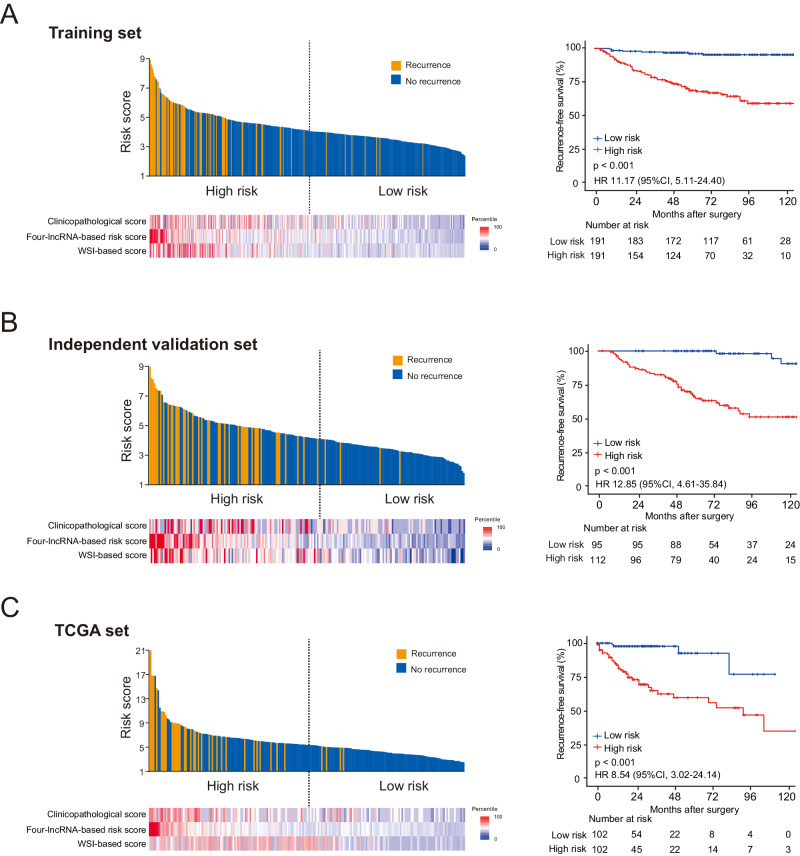
Fig. 2. Multi-classifier-based risk score and Kaplan–Meier survival analysis in the training set and two validation sets.
A The multi-classifier-based risk score and Kaplan–Meier survival analysis in the training set (n = 382). Upper left of panel: distribution of the multi-classifier-based risk scores and patient recurrence status. Lower left of panel: heat map showing the scores generated using each of the three classifiers independently. Right of panel: Kaplan–Meier survival analysis for RFS in patients with pRCC who were divided into low-risk and high-risk groups. B, C The multi-classifier-based risk scores and Kaplan–Meier survival analysis in the independent validation set (n = 207) and the TCGA set (n = 204), respectively. HRs, 95% CIs and two-sided P values were calculated using the Cox proportional hazards model. Source data are provided as a Source Data file.

