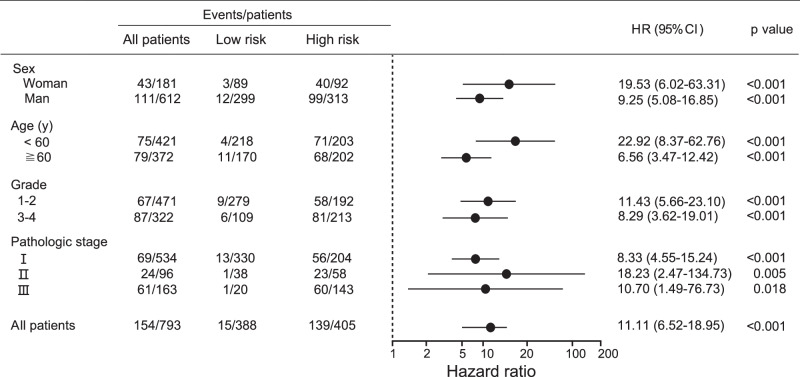
Fig. 3. HR of RFS for patients with pRCC predicted using the multi-classifier-based risk score in high-risk and low-risk groups.
The HR of RFS for all 793 patients with pRCC predicted using the multi-classifier-based risk score in subgroups stratified by clinical and pathological parameters. HRs, 95% CIs and two-sided P values were calculated using the Cox proportional hazards model. HRs are depicted as the central point for the error bars, while the 95% CI is represented by the length of the error bars. Source data are provided as a Source Data file.

