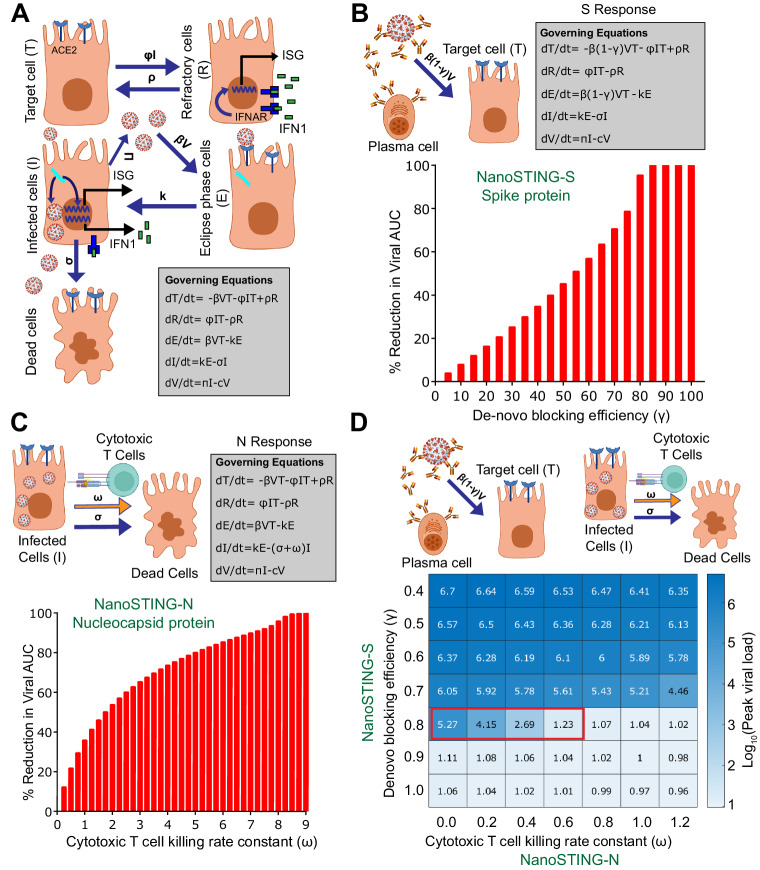
Fig. 2. Quantitative modeling of the combined immune response against both proteins predict synergistic protection.
A Schematic and governing equations describing viral dynamics without vaccination, with spike protein immunization, or nucleocapsid protein immunization (IFNAR interferon-α/β receptor, IFN1 type-I interferons, ISG interferon-stimulated gene). In the nasal compartment, SARS-CoV-2 (V) infects target epithelial cells (T) at the rate βV. The infected cells remain in an eclipse phase (E) before they become infected cells (I) with a rate constant (k) and start producing viral particles at rate π. The infected cells produce antiviral responses, which make the target cells refractory (R) with a rate constant directly proportional to the number of infected cells (ɸI). The infected cells die with a rate constant (σ). The refractory cells become target cells at rate (ρ). B Upon immunization with spike protein, the rate constant of target cell infection is reduced from βV to βV(1-γ) where γ is antibody-mediated blocking efficiency. The bar graph shows a percent reduction in viral area under the curve (AUC) with increasing de-novo blocking efficiency (antibodies against the spike protein). C Upon immunization with N protein, the rate constant of elimination of infected cells is increased by ω due to the killing of infected cells by T cells. The bar graph shows a percent reduction in viral AUC upon cytotoxic T cell-mediated killing of infected cells. D Upon immunization with N and S protein the rate constant of elimination of infected cells is increased by ω and the rate constant of target cell infection is reduced from βV to βV(1-γ). The heatmap shows the effectiveness of the combined effect of de-novo blocking (S response) and T cell-mediated killing (N response). The red box indicates the synergistic effect of N and S response in achieving multifactorial immunity. See also Supplementary Fig. 5, Supplementary Methods, Sup Note 1. Parts of (A–D) were created with BioRender.com released under a Creative Commons Attribution-NonCommercial-NoDerivs 4.0 International license (https://creativecommons.org/licenses/by-nc-nd/4.0/deed.en). Abbreviations - ACE2 angiotensin-converting enzyme 2, ISG interferon-stimulated gene, IFN1 type-I interferons, IFNAR interferon-α/β receptor, AUC area under the curve. Source data are provided as a Source Data file.

