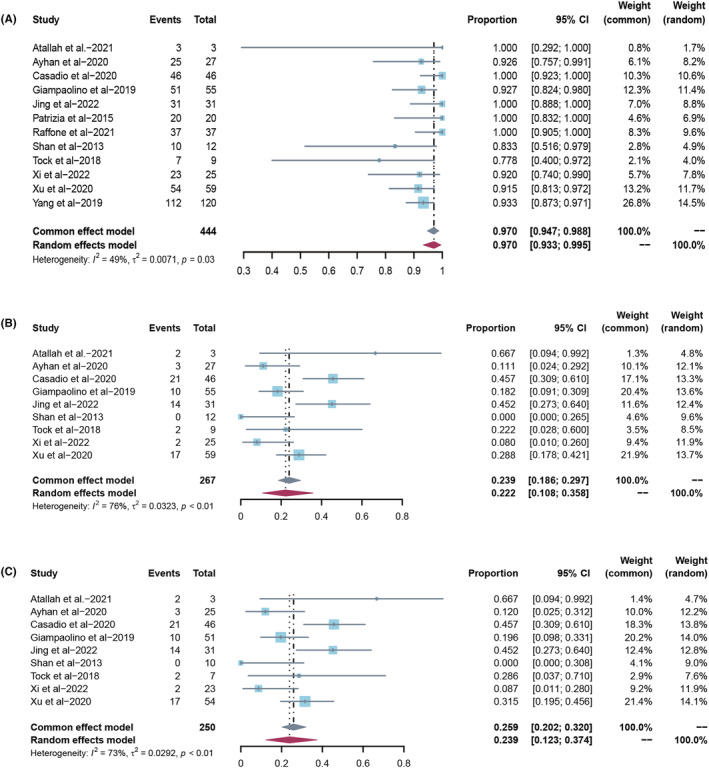
FIGURE 4.

(A) Overall complete response rate in all atypical hyperplasia patients treated with hysteroscopic resection‐based conservative therapy. (B) Overall live birth rate in all atypical hyperplasia patients treated with hysteroscopic resection‐based conservative therapy. (C) Overall live birth rate in atypical hyperplasia complete responders treated with hysteroscopic resection‐based conservative therapy.
