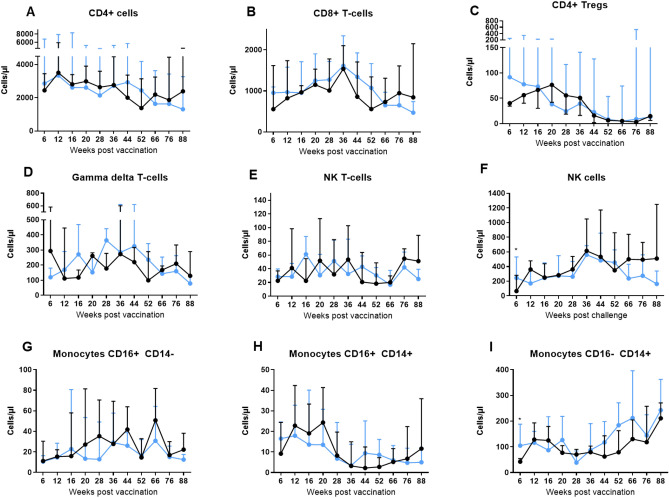
Figure 3.
Cell populations measured in whole blood using immunophenotyping following BCG vaccination within 7 days of birth. (A) CD4+ T-cells, (B) CD8+ T-cells, (C) CD4+ Tregs, (D) Gamma delta T-cells, (E) NK T-cells, (F) NK cells, (G) CD14+ CD16− monocytes, (H) CD14+ CD16+ monocytes, (I) CD14− CD16+ monocytes. Cells measured as absolute counts/ml of blood. Blue: BCG vaccinated (n = 34), black: unvaccinated (n = 9). Medians shown with interquartile range. Mann–Whitney-U tests between groups carried out,*p ≤ 0.05.

