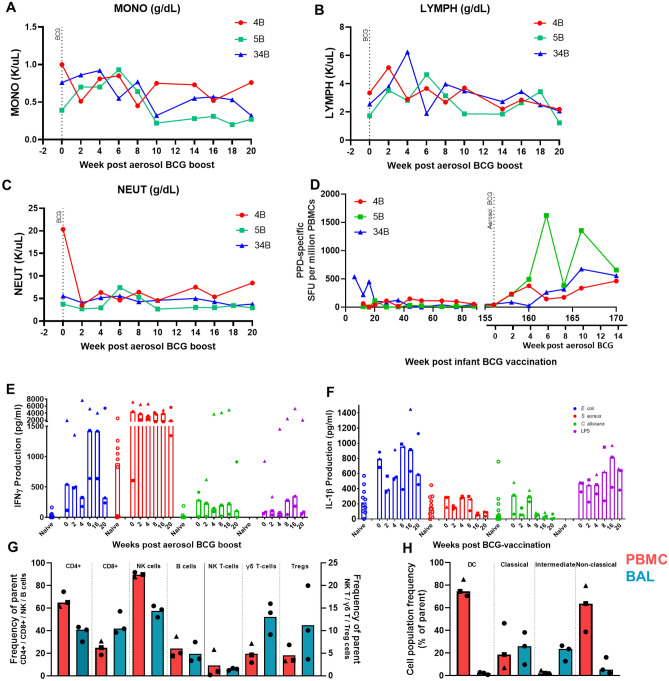
Figure 5.
Monitoring immune parameters following aerosol BCG revaccination, three years after initial infant BCG vaccination. (A) Concentration of monocyte, (B) lymphocyte, and (C) neutrophil populations in peripheral blood measured using a haematology analyser, median shown and 95% CI, (D) Frequency of PPD-specific IFNγ secreting cells measured by ELISPOT in peripheral blood after initial BCG vaccination in infancy and following aerosol BCG revaccination approximately 3 years later. Individual animals shown (E) IFNγ production (pg/ml) following stimulation of PBMC with E. coli (blue), S. aureus (red), C. albicans (green) or LPS (purple).Responses in separate naïve adult animals are shown as a comparison (hollow circles), (F) IL1β production (pg/ml) following stimulation of PBMC with E. coli (blue), S. aureus (red), C. albicans (green) or LPS (purple). Responses in separate naïve adult animals are shown as a comparison (hollow circles), (G) immunophenotyping of lymphocyte populations in the PBMC and BAL. Samples are gated as a proportion of parent population (CD4+, CD8+, NK T cells, γδ T cells from CD3+ population, B cells from lymphocytes, NK cells from CD3− CD8+ cells, and Tregs from CD3+ CD4+ cells), (H) immunophenotyping of monocyte populations in PBMC and BAL Samples are gated as a proportion of parent population (DCs from CD3− CD14− CD8− CD20− CD159− HLA-DR+ population, monocytes from total monocytes). Refer to supplementary data for full gating strategies. Red: PBMC, blue: BAL. Bars indicate median values with individual values shown by symbols.

