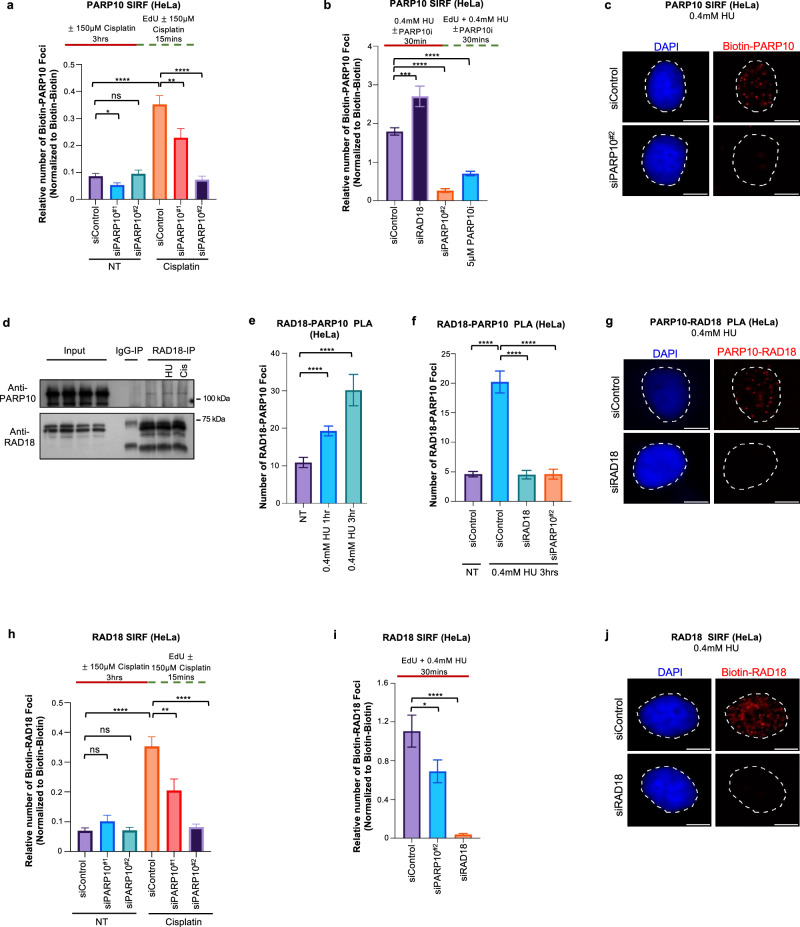
Fig. 2. PARP10 binds to nascent strand gaps and promotes the recruitment of RAD18 to these structures.
a–c SIRF experiments showing that treatment with 150 µM cisplatin (a) or 0.4 mM HU (b, c) induces binding of PARP10 to nascent DNA in HeLa cells. Quantifications (a, b) and representative micrographs, with scale bars representing 10 µm (c) are shown. At least 76 cells were quantified for each condition. Bars indicate the mean values, error bars represent standard errors of the mean, and asterisks indicate statistical significance (t-test, two-tailed, unpaired). Schematic representations of the assay conditions are shown at the top. d Co-immunoprecipitation experiment in HeLa cells showing that PARP10 co-precipitates with RAD18. Cells were treated with 0.4 mM HU, 150 µM cisplatin, or left untreated as indicated. e–g PLA assays showing that RAD18 and PARP10 co-localize upon treatment with 0.4 mM HU in HeLa cells. Knockdown of PARP10 or RAD18 is used as control to confirm the specificity of the PLA signals observed. Quantifications (e, f) and representative micrographs, with scale bars representing 10 µm (g) are shown. At least 45 cells were quantified for each condition. Bars indicate the mean values, error bars represent standard errors of the mean, and asterisks indicate statistical significance (t-test, two-tailed, unpaired). h–j SIRF experiments showing that PARP10 depletion reduces the binding of RAD18 to nascent DNA upon treatment with 150 µM cisplatin (h) or 0.4 mM HU (i, j) in HeLa cells. Quantifications (h, i) and representative micrographs, with scale bars representing 10 µm (j) are shown. At least 70 cells were quantified for each condition. Bars indicate the mean values, error bars represent standard errors of the mean, and asterisks indicate statistical significance (t-test, two-tailed, unpaired). Schematic representations of the assay conditions are shown at the top. Source data are provided as a Source Data file.

