FIG. 3.
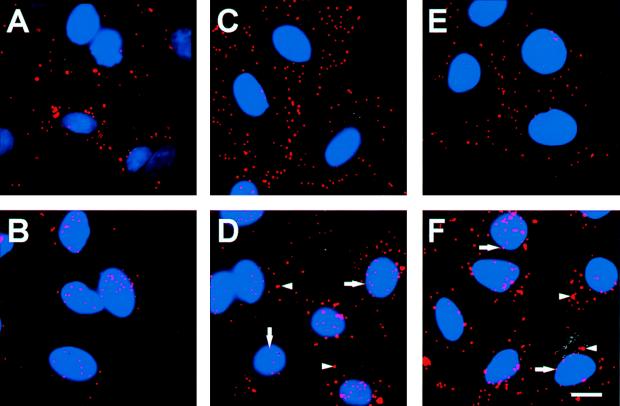
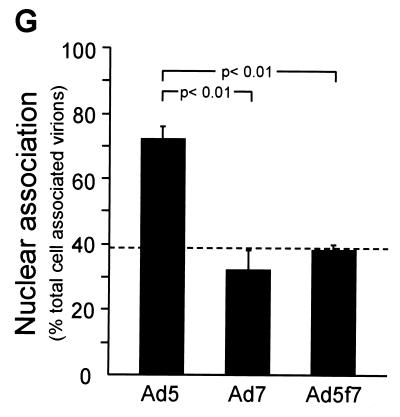
Intracellular distribution of Cy3-Ad5, Cy3-Ad7, and Cy3-Ad5f7 following binding and internalization. A549 cells were infected with Cy3-Ad (1011 particles/ml, 10 min at 37°C), washed, and either immediately fixed or incubated for 1 h at 37°C prior to fixation. Cy3-Ad (red) and DAPI-stained nuclei (blue) were evaluated. (A) Cy3-Ad5, 10-min infection. (B) Cy3-Ad5, 10-min infection plus a 1-h incubation. (C) Cy3-Ad7, 10-min infection. (D) Cy3-Ad7, 10-min infection plus a 1-h incubation. (E) Cy3-Ad5f7, 10-min infection. (F) Cy3-Ad5f7, 10-min infection plus a 1-h incubation. Bar = 10 μm. Arrows indicate small puncta. Arrowheads indicate larger aggregates of vector. (G) Percentage of nuclear localization relative to total cell-associated virions at 1 h following infection. The dashed line represents the background value (see Results).


