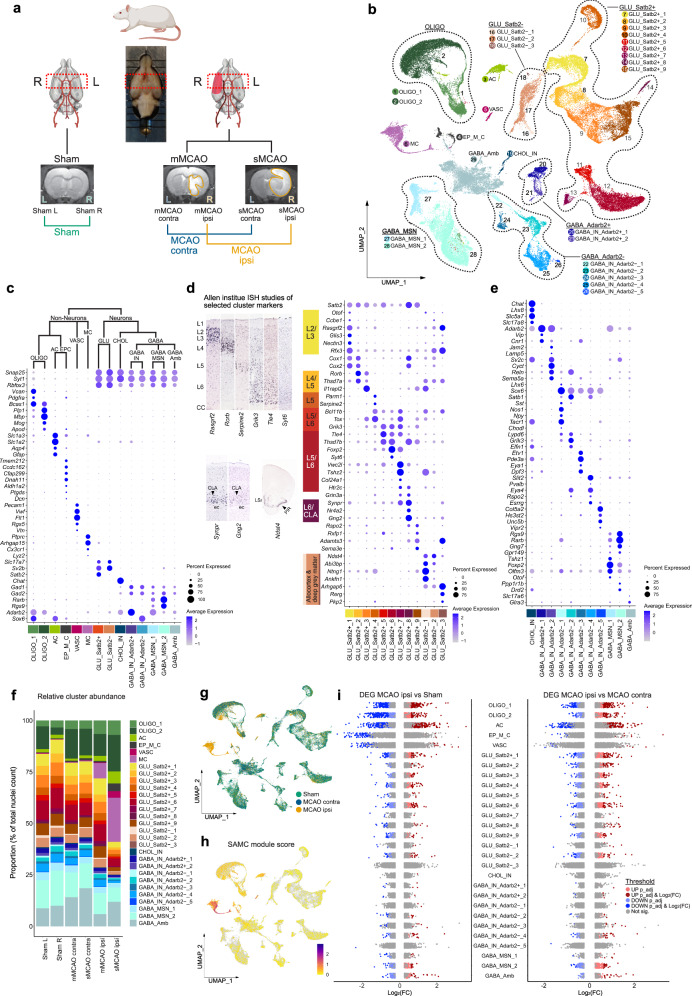
Fig. 1. snRNAseq reveals differential cell cluster abundance and cluster-specific transcriptional perturbations 48 h after ischemic stroke.
a Illustration of study design, depicting brain regions sampled for snRNAseq, from n = 4 Sham control rats and n = 7 middle cerebral artery occlusion (MCAO) group rats. MRI images of brain tissue from Sham-operated, moderate (mMCAO) and severe (sMCAO) MCAO group rats are presented, ischemic lesions are highlighted in orange. Rat schematic created with BioRender.com. MCAO ipsi MCAO group, hemisphere ipsilateral to ischemic lesion, MCAO contra MCAO group, hemisphere contralateral to ischemic lesion. b Uniform Manifold Approximation and Projection (UMAP) plot depicting 68616 nuclei annotated to 29 major cell clusters in the integrated dataset. Cell cluster AC astrocyte cluster, CHOL_IN cholinergic interneurons, EP_M_C ependymal and mural cell cluster, GABA_Amb Ambiguous GABAergic neuronal cluster, GABA_IN_Adarb2 + , GABA_IN_Adarb2- GABAergic interneurons, Adarb2 positive/negative, respectively, GABA_MSN GABAergic medium spiny neurons, GLU_Satb2 + , GLU_Satb2- Glutamatergic neurons, Satb2 positive/negative, respectively, OLIGO_1 immature oligodendrocyte lineage cluster, OLIGO_2 myelinating and mature oligodendrocyte lineage cluster. c–e Dotplots depicting curated marker genes for all major cell clusters. The dendrogram in (c) represents overarching taxons of identified major cell clusters. The dotplot in (d) depicts curated cluster markers of glutamatergic neurons. Colored bars next to the gene names denote established associations to cortical layers. Representative corresponding RNA in situ hybridization (ISH) results are depicted next to the colored bars. All RNA ISH studies were taken from Allen Brain Atlas database, and are referenced in detail in Supplementary Tab. 1. L = layer, CLA = claustrum, ec = external capsule, LSr = lateral septal nucleus, PIR = piriform cortex. e Dotplot depicting marker gene expression in cholinergic and GABAergic neurons. f Stacked bar plot depicting the relative abundance of each cell cluster within each sample. g Nuclei distribution coloured by treatment group. h Gene module score derived from the stroke-associated myeloid cell (SAMC) gene set13. i Strip plots depicting distribution of DEGs derived from MCAO ipsi vs Sham and MCAO ipsi vs MCAO contra comparisons, for all major cell clusters. DEGs were calculated using the MAST statistical framework as specified within the Methods section. Source data are provided within Supplementary data.

