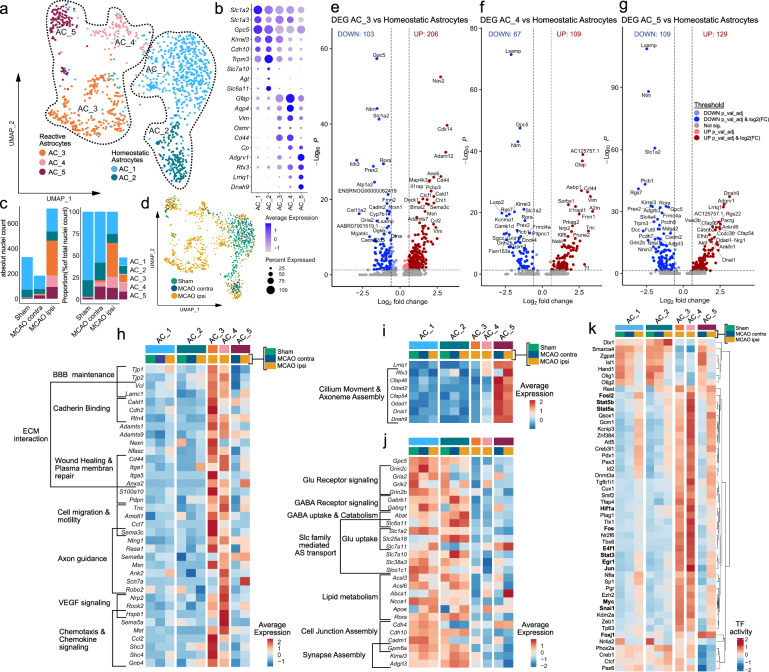
Fig. 4. Transcriptional heterogeneity of reactive astrocytes within infarcted brain tissue.
a–d Subclustering analysis of astrocytes. a Uniform Manifold Approximation and Projection (UMAP) plot depicting 1233 nuclei annotated to 5 astrocyte (AC) subclusters. b Dotplot depicting curated homeostatic and reactive astrocyte marker genes. c Stacked bar plots depicting the absolute and relative abundance of each subcluster within each group. MCAO ipsi MCAO group, hemisphere ipsilateral to ischemic lesion, MCAO contra MCAO group, hemisphere contralateral to ischemic lesion. d Nuclei distribution coloured by group. e–g Volcano plots depicting DEGs derived from the comparison of the reactive astrocyte subclusters AC_3 (e), AC_4 (f) and AC_5 (g) to the homeostatic astrocyte subclusters (AC_1 and AC_2, pooled). DEGs were calculated using the MAST statistical framework as specified within the Methods section. h–j Heatmaps depicting the average scaled gene expression of curated upregulated DEGs, derived from the comparison of AC_3 and AC_4 (h) and AC_5 (i) to homeostatic astrocytes, as well as DEGs downregulated in reactive astrocytes (j), split by subcluster and group. BBB Blood brain barrier, ECM Extracellular matrix, Slc Solute carrier, AS Amino acid (k) Clustered heatmap depicting the top 50 most variable transcription factor (TF) activities, within the astrocyte subclustering analysis, split by subcluster and treatment group. Source data are provided within Supplementary data.

