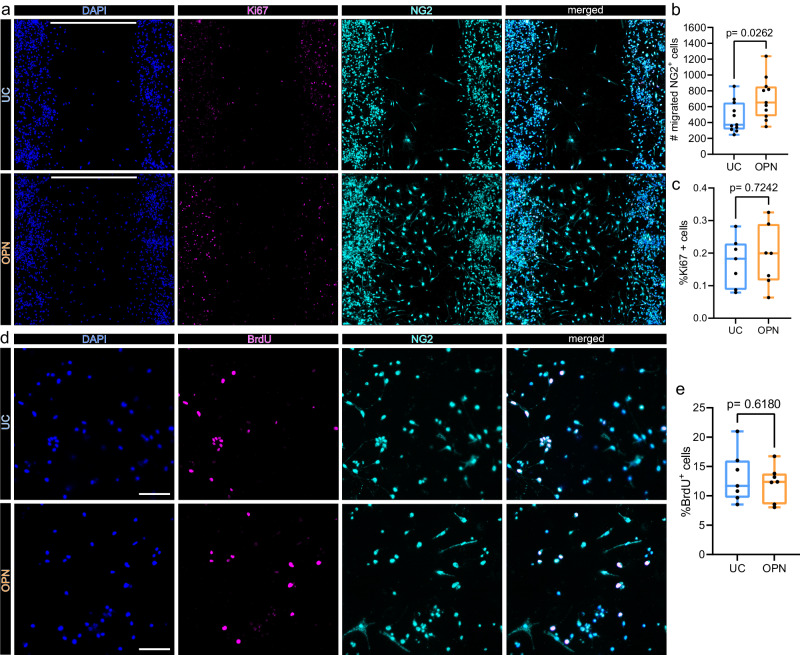
Fig. 7. Osteopontin induces OPC migration but not proliferation in vitro.
a–c In vitro cell migration assay. Cells were seeded in 2 well culture inserts, creating defined 500 µm gaps. NG2 positive cells which migrated into the 500 µm gap were quantified after 48 h of treatment. a Representative images of OPC cell cultures 48 h after incubation without (upper panel: untreated control = UC), or with 1 µg/ml osteopontin (OPN) (lower panel), stained for DAPI (nuclei) = blue, Ki67 = magenta and NG2 = cyan, split by channel. Scale bars denote 500 µm gaps. b Box plot depicting the number of NG2 positive cells, which migrated into 500 µm gaps, for each condition, p-values derived from two-sided unpaired Student´s t test (t = 2.400, df=20, n = 11 replicates per group (independent wells), from 3 independent experiments). In n = 7 replicates (independent wells) per group from 2 independent experiments Ki67 was visualized (c). c Box plot depicting the percentages of Ki67+ cells within the 500 µm gap, for each condition, p values derived from unpaired two-sided Student´s t test (t = 0.3612, df = 12). d–e Bromodeoxyuridine (BrdU) incorporation assay. d BrdU incorporation was visualized 24 h after incubation without (UC) (upper panel) or with 1 µg/ml OPN (lower panel). Representative x20 magnification images are shown, stained for DAPI (Nuclei) = blue, BrdU = magenta and NG2 = cyan, split by channel. Scale bars = 100 µm. e Box plot depicting the percentages of BrdU+ cells, for each group, p values derived from unpaired two-sided Student´s t test (t = 0.5119, df = 12, n = 7 replicates per group, from 2 independent experiment). All box plots depict medians, 25th to 75th percentiles as hinges, minimal and maximal values as whiskers, and individual counts, for each replicate as dots. Source data are provided as a Source Data file.

