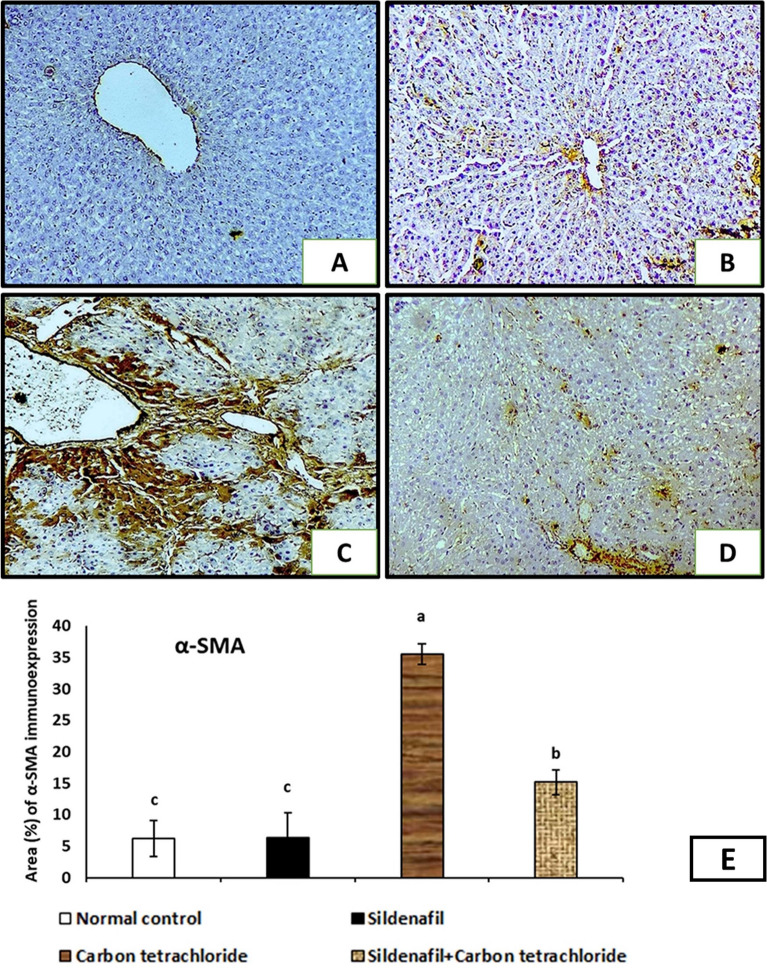
Figure 4.
Immunohistochemical expression of α-smooth muscle actin (α-SMA) in liver tissue from different experimental groups. The brown color indicating positivity. (A) The control group (G1) showed slight amount of α-SMA-positivity merely seen in vascular wall. (B) G2 received sildenafil showed no difference compared with control. (C) G3 rats that received CCl4 showed the α-SMA protein is highly expressed in the area of central vein, portal tract, and between hepatocytes. (D) G4 received sildenafil and CCl4 and showed mild α-SMA-expression; however, the level of positivity is lower than in the G3. (Anti-α-SMA immunostaining ×100). (E) Digital morphometric study of area (%) of α-SMA immunohistochemical staining sections of liver of experimental rats. Data were used to estimate the degree of α-SMA immunohistochemical staining. P < 0.05 compared with different experimental groups. Bars represent mean ± SDM. (n = 10).

