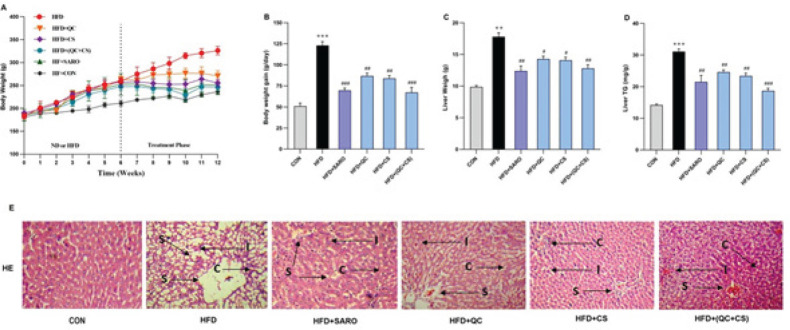
Figure 1.
Changes in body mass and liver index, triglyceride (TG), and morphology in the Wistar rats
(A) Body weight in grams, (B) Body weight gain, (C) liver weight, and (D) liver TG were significantly increased in the High-fat diet (HFD) Rat model compared with the control group. After treatment with Saroglitazar (SARO), quercetin (QC), Capparis spinosa (CS), and QC+CS these variables decreased significantly compared to the HFD group. **P<0.01 and ***P<0.001 vs control group, and #P<0.05, ##P<0.01, and ###P<0.001 vs HFD group. (E) Histopathological analysis of the HFD model before and after therapy with SARO, QC, CS, and a QC+CS combination. Typical images of 100X-magnified hematoxylin-eosin stained liver tissue from various treatment groups. (C: congestion; I: inflammation; S: steatosis)
SARO: Saroglitazar; QC: Quercetin; CS: Capparis spinosa

