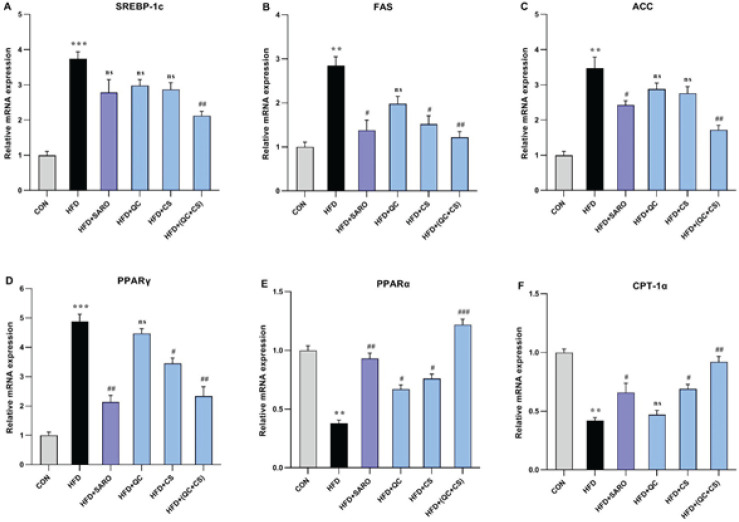
Figure 3.
Assessment of the level of lipid metabolism genes in liver tissue of rats fed a high-fat diet (HFD)
Using quantitative real-time PCR, hepatic mRNA levels were measured and normalized to GAPDH mRNA expression. The values are shown as the mean standard deviation of fold changes compared to the CON (Control) group. ANOVA was followed by the Tukey-Kramer test for multiple comparisons to evaluate between-group differences. **P<0.01, ***P<0.001, and ****P<0.0001 vs control group, and, #P<0.05, ##P<0.01, and ###P<0.001 vs HFD group
SREBP-1C, Sterol regulatory element-binding protein 1C; FAS, Farnesyl pyrophosphate synthase; ACC, Acetyl-CoA carboxylase; PPAR γ/α, peroxisome proliferator-activated receptor gamma /alpha and CPT-1 α, Carnitine Palmitoyltransferase I

