
Figure 5.
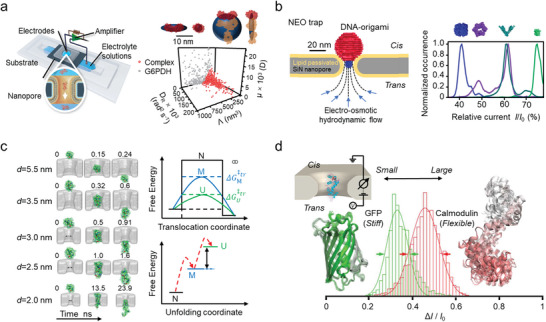
Electrical characterizations of protein spatial structure and structural change with nanopore. a) Schematic of single protein identification through a bilayer‐coated nanopore (left), and the characterizations of single protein and protein complex (right). Reproduced with permission.[ 68 ] Copyright 2016, Springer Nature. b) Schematic of Nanopore electro‐osmotic trap (NEO trap, left), and the mass‐ and shape‐dependent single protein identification (right). Reproduced with permission.[ 23d ] Copyright 2021, Springer Nature. c) Conformationally excited states of protein during translocation, and schematic energy diagram for translocation. Reproduced with permission.[ 23c ] Copyright 2021, National Academy of Sciences, U.S.A. d) Protein size and structural fluctuations measurements using solid‐state nanopore. Reproduced with permission.[ 70 ] Copyright 2017, American Chemical Society.