
Figure 7.
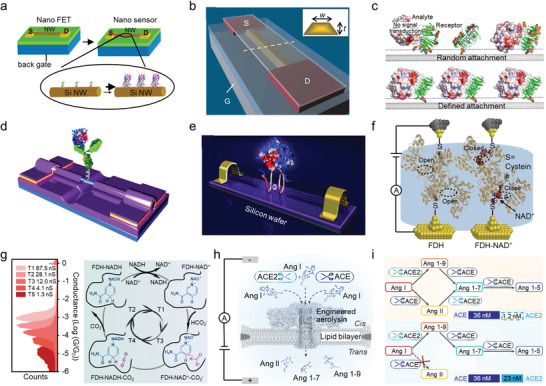
Electrical detection of biological interactions and reactions. a) Schematic representation of streptavidin binding to a SiNW FET through the biotin‐streptavidin interaction. Reproduced with permission.[ 16c ] Copyright 2001, The American Association for the Advancement of Science. b) CMOS‐compatible FET fabrication via anisotropic wet etch. Reproduced with permission.[ 91 ] Copyright 2007, Springer Nature. c) Schematic of a single antibody‐decorated SiNW FET. Reproduced under the terms of the CC‐BY license.[ 93 ] Copyright 2021, The Authors, published by Wiley‐VCH GmbH. d) Schematic of orientation‐controlled binding of a protein on the SWCNT surface. Reproduced with permission.[ 95 ] Copyright 2014, WILEY‐VCH Verlag GmbH & Co. KGaA, Weinheim. e) Schematic of a single protein junction with a DNA aptamer on SWCNT electrodes. Reproduced with permission.[ 96 ] Copyright 2011, WILEY‐VCH Verlag GmbH & Co. KGaA, Weinheim. f) Schematic of charge transport in a single‐molecule FDH junction and an FDH‐NAD+ junction. Reproduced under the terms of the CC‐BY‐NC‐ND license.[ 98 ] Copyright 2020, The Authors, published by Elsevier. g) Conductance changes of the corresponding process of an enzymatic reaction with a single‐molecule FDH. Reproduced with permission.[ 99 ] Copyright 2023, Springer Nature. h) Identification of degradation products upon Ang I cleavage by ACE and ACE2. i) Degradation pathway of Ang I in the presence of ACE and ACE2. Reproduced with permission.[ 100 ] Copyright 2023, Springer Nature.