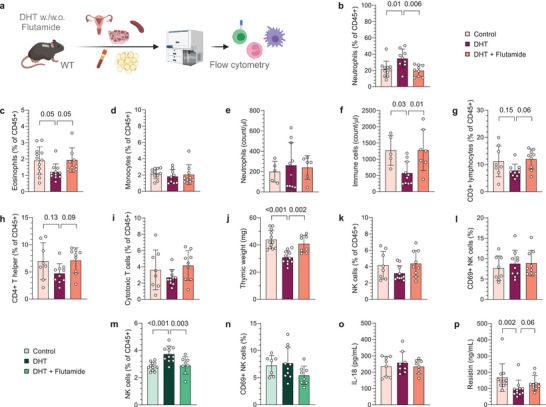
Figure 1.

Immune populations in blood and secondary lymphoid organs are differently affected by androgen exposure. a) Experimental design. b) Frequency of neutrophils in blood, expressed as a percent of CD45+ immune cells (n = 11 Control, 9 DHT, 9 DHT + Flutamide). c) Frequency of eosinophils in blood (n = 12, 11, 8). d) Frequency of monocytes in blood (n = 11, 9, 9). e) Neutrophil count in blood (n = 5, 10, 6). f) CD45+ immune cell count in blood (n = 5, 10, 7). g) Frequency of CD3+ T cells in blood (n = 8, 10, 9). h) Frequency of CD4+ T helper cells in blood (n = 8, 10, 9). i) Frequency of CD8+ cytotoxic T cells in blood (n = 8, 10, 9). j) Thymus weight (n = 12, 11, 8). k) Frequency of NK cells in blood (n = 8, 10, 9). (l) CD69 expression on NK cells in blood (n = 8, 10, 9). m) Frequency of NK cells in spleen (n = 12, 11, 8). n) CD69 expression on NK cells in spleen (n = 7, 10, 8). o) Plasma levels of IL‐18 (n = 8, 8, 8). p) Plasma levels of resistin (n = 11, 11, 9). Data are presented as means ± SD. n indicates the number of biologically independent samples examined. Statistical analysis was assessed by one‐way ANOVA with Dunnett's multiple comparison b,e–j,m–o) or by Kruskal‐Wallis with Dunn's multiple comparison c,d,k,l,p), and significant differences were indicated with p values. Source data are provided as a Source Data File.
