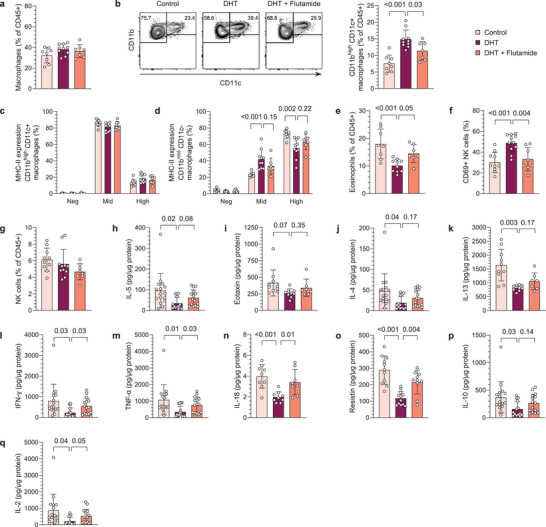
Figure 5.

DHT‐exposed PCOS‐like mice display an aberrant immune profile in VAT albeit unaltered fat mass. a) Frequency of macrophages among immune cells in VAT (n = 8 Control, 10 DHT, 7 DHT + Flutamide). b) Representative plots of subpopulations of macrophages (CD45+CD11b+SSClow/midF4/80+Ly6Gmid) based on the expression of CD11b and CD11c and frequency CD11bhighCD11c+. c) MHC‐II expression on CD11bhighCD11c+ macrophages (n = 8, 10, 7). d) MHC‐II expression on CD11bmidCD11c− macrophages (n = 8, 10, 7). e) Frequency of eosinophils in VAT (n = 8, 10, 7). f) CD69 expression on NK cells in VAT (n = 10, 11, 8). g) Frequency of NK cells in VAT (n = 10, 11, 8). h) IL‐5 levels in VAT (n = 16, 14, 15). i) Eotaxin (CCL11) levels in VAT (n = 10, 9, 7). j) IL‐4 levels in VAT (n = 16, 14, 15). k) IL‐13 levels in VAT (n = 10, 9, 7). l) IFN‐γ levels in VAT (n = 16, 16, 15). m) TNF‐α levels in VAT (n = 16, 16, 15). n) IL‐18 levels in VAT (n = 9, 9, 8). o) Resistin levels in VAT (n = 11, 12, 10). p) IL‐10 levels in VAT (n = 16, 14, 15). q) IL‐2 levels in VAT (n = 16, 16, 15). Data are presented as means ± SD. n indicates the number of biologically independent samples examined. Statistical analysis was assessed by one‐way ANOVA with Dunnett's multiple comparison a–f, n,o), Kruskal‐Wallis with Dunn's multiple comparison g), or mixed‐effects ANOVA with Bonferroni's multiple comparison test h–m,p,q) and significant differences were indicated with p values. Source data are provided as a Source Data File.
