
Figure 3.
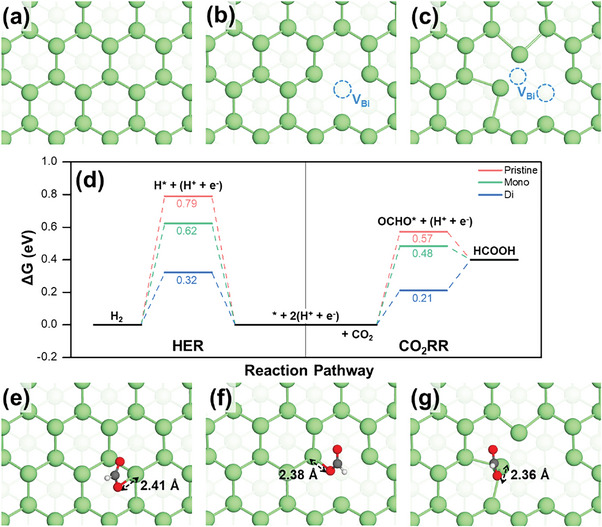
DFT‐optimized structures of a) pristine Bi surface, and defective Bi surfaces with b) mono‐vacancy and c) di‐vacancy. The Bi vacancy site (VBi) is highlighted by a blue dashed circle. d) Free‐energy diagrams for CO2RR to generate formate and HER on the pristine Bi surface (pink line) and the defective surfaces (green line for mono‐vacancy surface and blue line for di‐vacancy surface). OCHO adsorption structures of e) pristine Bi surface, and defective Bi surfaces with f) mono‐vacancy and g) di‐vacancy. The green, red, gray, and white balls represent Bi, O, C, and H, respectively.