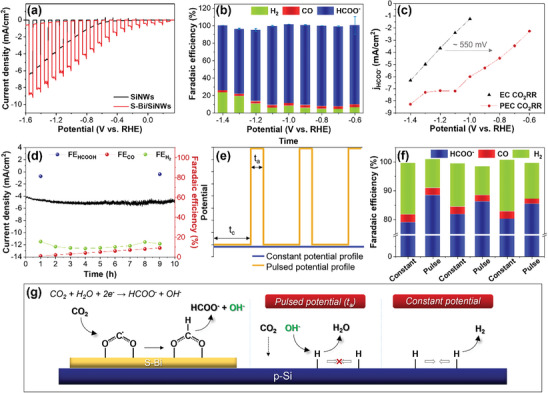
Figure 6.

PEC‐CO2RR efficiency of S‐Bi/SiNWs and SiNWs in 0.1 m KHCO3 under light irradiation (light intensity: 100 mW cm−2). a) LSVs in CO2‐saturated electrolyte (scan rate: 10 mV s−1). b) Faradaic efficiency (blue: HCOO−, red: CO, green: H2) of S‐Bi/SiNWs depending on applied potentials. c) Comparison of the partial current density of HCOO− for S‐Bi/CP (black) and S‐Bi/SiNWs (red). d) Stability of S‐Bi/SiNWs at −0.8 V versus RHE and the corresponding Faradaic efficiency. e) Schematic of applied constant potential (blue) and pulsed potential (yellow). f) Consecutive Faradaic efficiency (blue: HCOO−, red: CO, green: H2) of S‐Bi/SiNWs during alternating pulsed potential cycles (E −1.4 V = 3 s, E0 .1 V = 1 s) and constant potential (E −1.4 V) measurements. g) Schematic of the proposed CO2 reduction mechanism during the pulsed potential and constant potential electrolysis.
