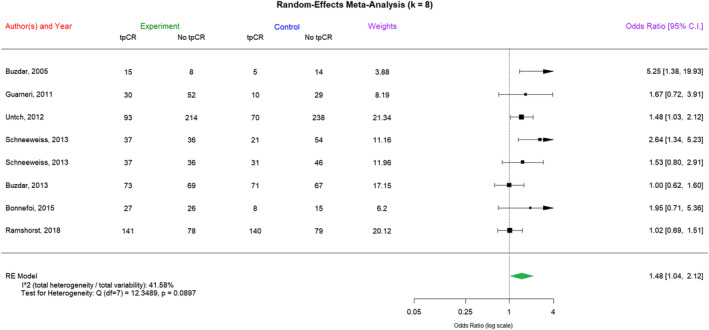
FIGURE 3.

The forest plot of pathological complete response (pCR) rates. A random‐effects meta‐analysis of the pCR rate in concurrent epirubicin–trastuzumab regimens and nonconcurrent regimens was shown here. “Experiment” refers to the concurrent epirubicin–trastuzumab regimens and “Control” refers to the nonconcurrent regimens. An OR >1 indicated that the concurrent regimen of epirubicin and trastuzumab was associated with a higher pCR rate.
