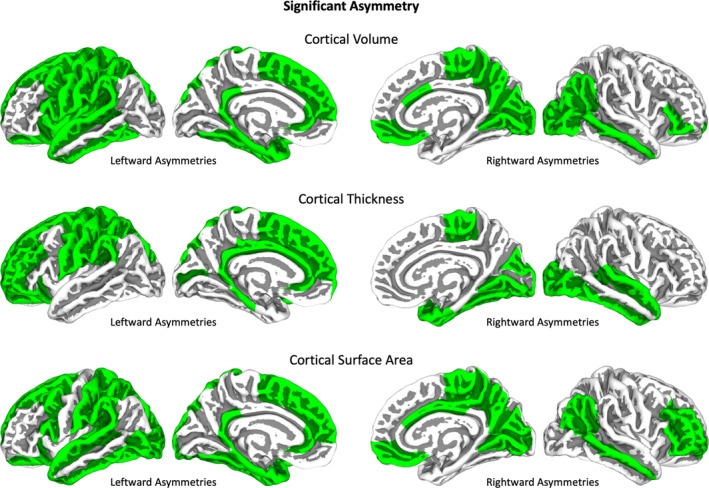
FIGURE 1.

Hemispheric asymmetry. Cortical regions with significant asymmetries are indicated in green. The regions defined by the Desikan–Killiany atlas (Desikan et al., 2006) were projected onto the central surface of the FSAverage template using the CAT12 toolbox (Gaser et al., 2022). Rightward asymmetries are indicated on the right hemispheres, leftward asymmetries on the left hemispheres. All significant asymmetries are FDR‐corrected using a threshold of 0.05 (Benjamini & Yekutieli, 2001; Hochberg & Benjamini, 1990).
