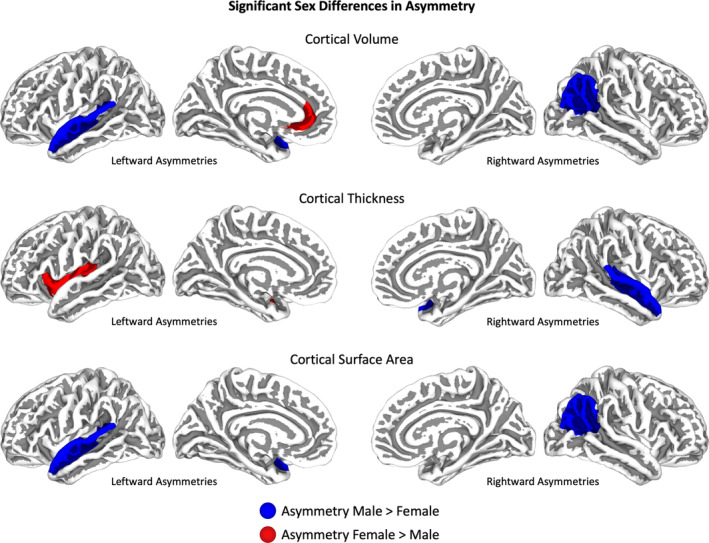
FIGURE 3.

Sex differences in asymmetry. Cortical regions with significantly larger asymmetries in males are depicted in blue, and with significantly larger asymmetries in females in red. Rightward asymmetries are indicated on the right hemispheres, leftward asymmetries on the left hemispheres.
