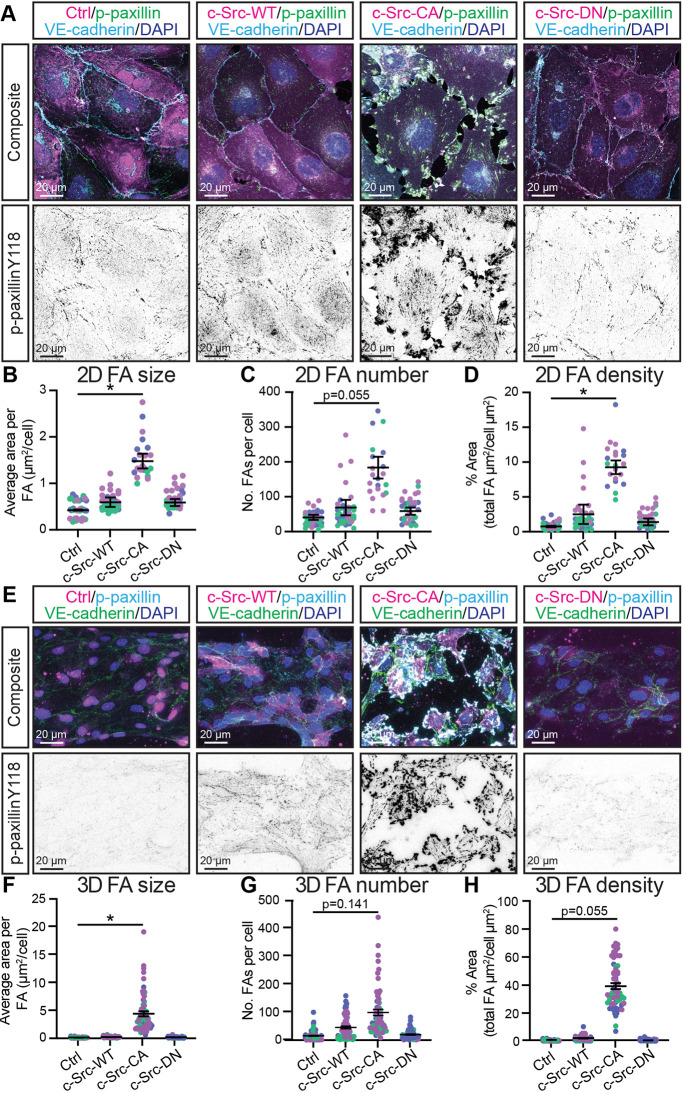
Fig. 2.
Constitutively active c-Src induces FA formation and disrupts cell-cell junctions in 2D and 3D. (A) Representative images of confluent monolayers of HUVECs transduced with mScarlet-tagged c-Src WT, mutants (CA or DN) or control (Ctrl; empty vector mScarlet) (magenta), with immunofluorescence staining performed for FAs [phospho (p)-paxillin Y118; green, shown as individual grey channel in bottom panel], VE-cadherin (cyan) and nuclei (DAPI; blue). (B–D) Quantification of average FA size (B), number (C), and density (D) per cell. n=3 independent experiments, 5 images per replicate with each data point representing an average of 3–5 cells per image. (E) Representative images of HUVECs transduced as in A (magenta) and seeded in PDMS microfluidic vessels containing 2.5 mg/ml collagen matrix for 3 days before fixing. Immunofluorescence staining was performed for FAs (p-paxillin Y118; cyan, shown as individual grey channel in bottom panel), VE-cadherin (green) and nuclei (DAPI; blue). (F–H) Quantification of average FA size (F), number (G), and density (H) per cell. n=3 independent experiments, 4–5 images per replicate with each data point representing an average of 3–5 cells per image. All data are represented as mean±s.e.m. with individual data point indicated and colours representing independent experiments, and large circles representing average mean per replicate. *P<0.05 (Kruskal–Wallis test with Dunn's multiple comparisons). The mean value of each individual replicate and corresponding s.e.m., instead of all data points separately, was used for statistical analysis.

