Fig. 4.
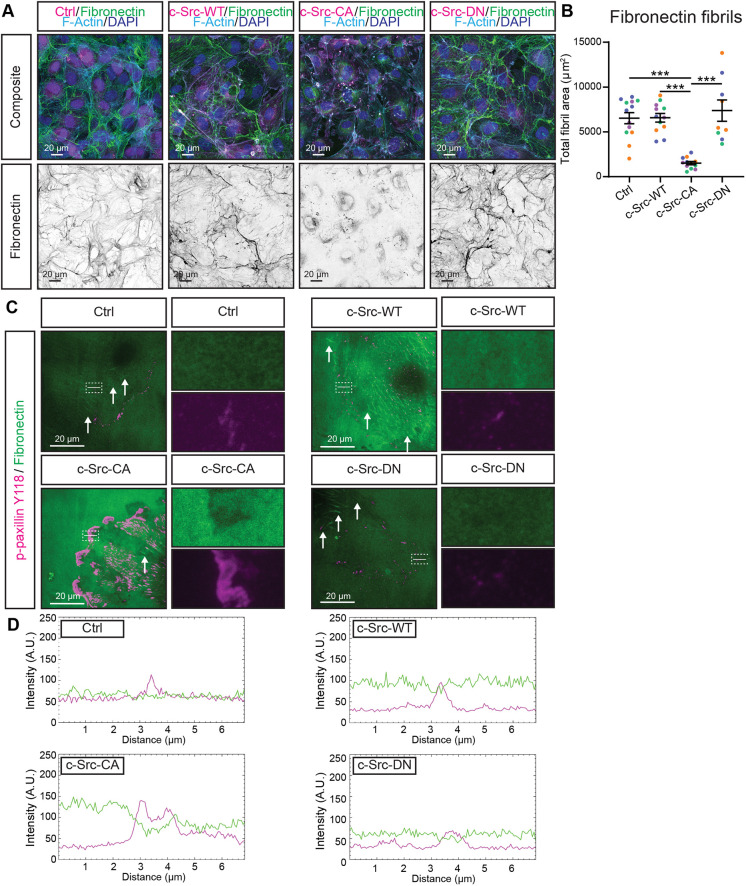
Constitutively active c-Src disrupts fibrillogenesis and degrades fibronectin locally at FAs. (A) Representative images of HUVECs transduced with mScarlet-tagged c-Src WT, mutants (CA or DN) or control (Ctrl; empty vector mScarlet) (magenta) grown on fibronectin-coated glass for 24 h before fixing. Immunofluorescence staining was performed for fibronectin (green, shown as individual grey channel in bottom panel), F-actin (phalloidin; cyan) and nuclei (DAPI; blue). (B) Quantification of total fibronectin fibril area per image. n=4 independent experiments, 3 images per replicate. (C) Representative images of total internal reflection fluorescence (TIRF) microscopy of sub-confluent mScarlet-tagged c-Src mutant HUVECs grown on fibronectin for 4 h before fixing. Immunofluorescence staining was performed for fibronectin (green) and focal adhesions (p-paxillin Y118; magenta). White dashed box indicates region of higher magnification, single channel images are shown next to the merge, white lines indicate area used to generate intensity plots, white arrows indicate fibronectin fibrils. (D) Intensity plots of areas of interest indicated by white lines in C to demonstrate a decrease in fibronectin (green) intensity at sites of increased focal adhesion signal (magenta). All lines are 7 µm and traverse through a focal adhesion. All data are represented as mean±s.e.m. with individual data points indicated and colours representing independent experiments. ***P<0.001, ****P<0.0001 (Kruskal–Wallis test with Dunn's multiple comparisons). Images in C and D are representative of three independent experiments, 3–5 images per replicate.

