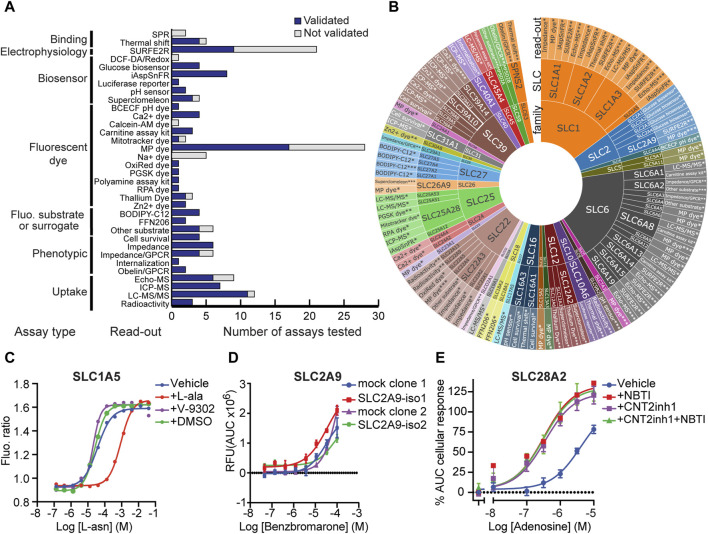
FIGURE 1.
SLC functional assays developed in RESOLUTE. (A) Technologies tested by RESOLUTE. Different assay types and the assay readout are shown. The bar chart indicates the number of successfully developed assays in comparison to the total number of investigated assays. (B) Assays validated by RESOLUTE. Detailed assay readout used for each SLC is displayed for each SLC, classified by the SLC family. *Proof-of-concept, **medium-throughput, and ***high-throughput assays. (C) Measurement of asparagine uptake in the SLC1A5 assay after its conversion to aspartate by transfected gpASNase and using the biosensor AspSnFR HEK293 cells. To test the effect of the reported inhibitor V-9302, cells were pretreated with 50 µM of V-9302. (D) Dose–response curve of the reported inhibitor benzbromarone using a membrane potential dye-based assay on HEK293 cells stably expressing isoform-1 or -2 of SLC2A9, a comparison with two different mock cell line clones. (E) Effect of “CNT2 inhibitor 1” (CNT2inh1) on adenosine-mediated response in non-induced (-dox) HEK293–JumpIn–SLC28A2 cells using an impedance-based assay. Dose–response curves of adenosine with or without pre-treatment with the SLC29A1 inhibitor NBTI and/or SLC28A2 inhibitor “CNT2 inhibitor 1”. Cells were pretreated with 31.6 µM “CNT2 inhibitor 1” and/or 1 µM NBTI to inhibit SLC28A2 and SLC29A1, respectively, for 1 h prior to stimulation with increasing concentrations of adenosine. Data points show the mean ± SEM.

