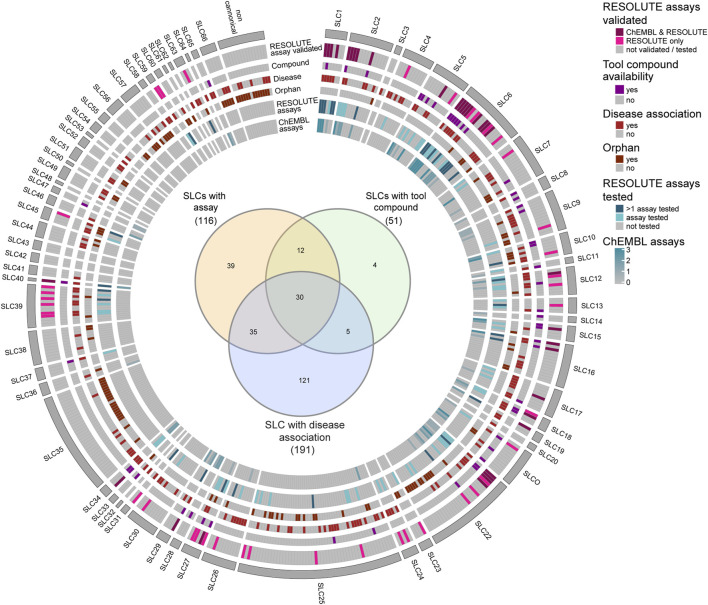
FIGURE 3.
Schematic representation of features of SLC transporters, highlighting availability of assays, tool compounds, disease association, and orphan status. SLCs in the individual families are ordered numerically. The Venn diagram (Heberle et al., 2015) shows the intersection between SLCs with disease association, SLCs with available assays, and SLCs with available tool compounds. As a source for orphan status and disease association, the RESOLUTE knowledgebase was used (Goldmann et al., in preparation).

