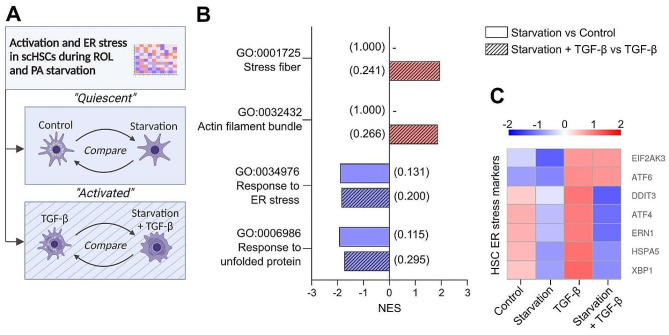
Fig. 4.
Endoplasmic reticulum (ER) stress during the activation of human scHSCs. (A) Schematic outline of the comparisons made in the mRNA sequencing data. (B) Gene Ontology (GO) terms upregulated (red) and downregulated (blue). Numbers in parentheses show the FDR q-value. NES: Normalized enrichment score. GO: Gene ontology. n = 4 cell lines were sequenced, with N = 3 technical replicates per condition. (C) Heatmap showing the z-score of selected HSC-typical ER stress-related genes from mRNA sequencing data. n = 4 cell lines were sequenced, with N = 3 technical replicates per condition

