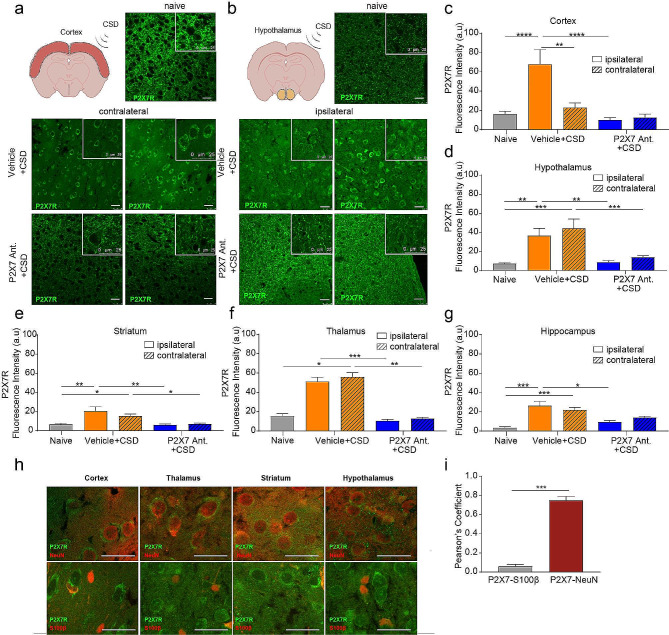
Fig. 5.
P2X7R signal is increased in cortical and subcortical structures that localizes to neurons and is prevented by P2X7R antagonism. (a) Representative images of cortical P2X7R immunofluorescent staining in naïve mice and in mice following optogenetic CSD induction with or without P2X7R antagonist administration. scale bar:25 µm (b) Representative images of hypothalamic P2X7R immunofluorescent staining. scale bar:25 µm (c) Fluorescence intensity of cortical P2X7R signal in naïve mice and in mice following optogenetic CSD induction with or without P2X7R antagonist administration (n = 5/group). (d) Fluorescence intensity of hypothalamic P2X7R signal (n = 5/group). (e) Fluorescence intensity of striatal P2X7R signal (n = 5/group). (f) Fluorescence intensity of thalamic P2X7R signal (n = 3/group). (g) Fluorescence intensity of hippocampal P2X7R signal (n = 5/group). (h) Representative images of P2X7R signal following CSD co-stained with either NeuN or S100β. (i) Pearson coefficient of P2X7R- S100β or P2X7R-NeuN colocalization (n = 3/group). (ns:p > 0.05, *:p < 0.05, **:p < 0.01, ***:p < 0.001)

