. 2024 Jun 11;26(29):19630–19645. doi: 10.1039/d4cp01785d

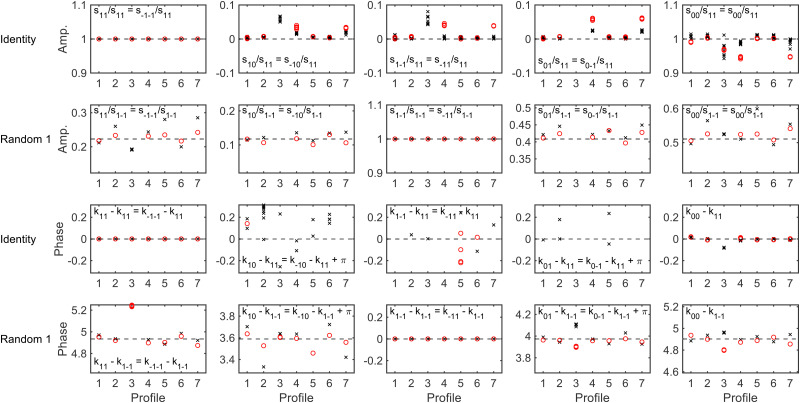
Fig. 11. The (unique) amplitudes (top two rows) and phases (bottom two rows) of the scattering-matrix elements obtained by fitting the signals generated for an identity scattering-matrix (first and third row) and the first randomly generated scattering-matrix (second and fourth row) with 1% noise using the 50 μm expansion hexapole probabilities (black crosses) and the 250 μm shifted by 200 μm expansion (red circles) using the magnetic field profiles noted along the x-axis. The magnetic field profiles used in the propagation correspond to those defined in Table 3. The dashed horizontal lines show the value of the scattering-matrix elements used to simulate the data.

Fig. 11