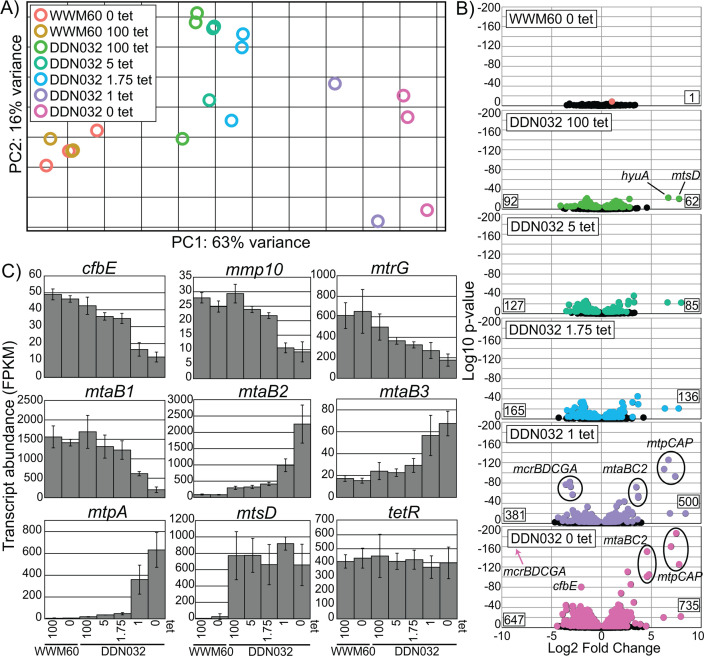
Fig 4.
Global transcriptomic response to MCR limitation. (A) Global transcriptomic response to different tetracycline concentrations captured by principal component analysis. (B) Volcano plots depicting the log2-fold change for genes of all conditions compared to WWM60 grown on 100 µg/mL tetracycline. Negative values indicate lower expression relative to WWM60 on 100 µg/mL tetracycline. All genes significantly differentially expressed based on multiple comparison adjusted P-value cutoff of 0.01 are shown in color and nonsignificant genes in black. Numbers on the bottom left and right corners of each plot represent the total number of genes significantly down or upregulated, respectively. Certain genes exhibiting strong fold-change differences mentioned in the text are highlighted. (C) Specific gene expression profiles as a function of tetracycline concentration. Error bars represent standard deviations of biological triplicates. For mtpA and mtsD, all DDN032 conditions are significantly upregulated compared to WWM60 at a multiple comparison corrected P-value of <0.01 as determined by DESeq2. tetR is not significantly differentially expressed under any conditions. Note: for DDN032 grown with 1 µg/mL, only two replicates were available for RNA sequencing.

