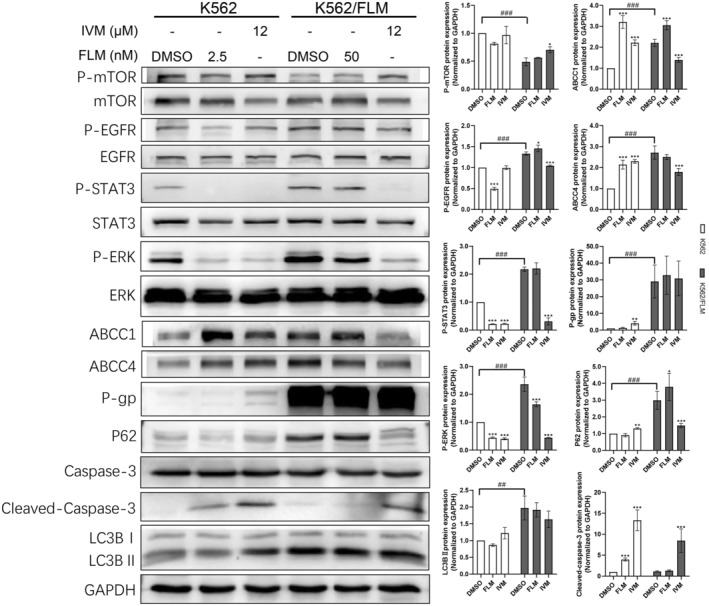
FIGURE 5.

K562/FLM cells resist flumatinib by increasing autophagy levels, high expression of drug‐efflux proteins, and hyperactivation of the EGFR/STAT3/ERK signalling pathway, whereas ivermectin is able to reverse the flumatinib resistance in K562/FLM by inhibiting these mechanisms. The phosphorylation levels of MTOR/EGFR/STAT3/ERK, the protein levels of P‐gp, ABCC1, ABCC4, p62, LC3B in K562 and K562/FLM cells under different administration concentrations of flumatinib and ivermectin. GAPDH was used as the loading control. *p < 0.05, **p < 0.01, ***p < 0.001 versus the DMSO group. ## p < 0.01, ### p < 0.001 versus the K562 group, Error bars indicate SD (n = 3).
