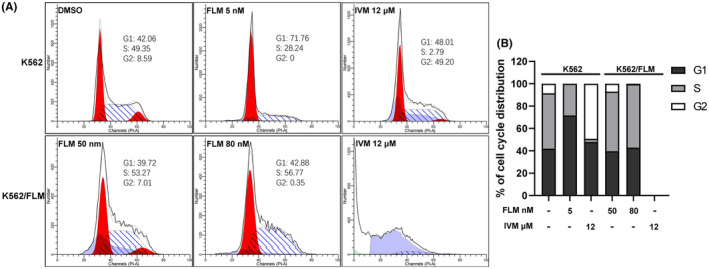
FIGURE 7.

Differential effects of flumatinib and ivermectin on cell cycle progression in K562 and K562/FLM cells. (A) Cell‐cycle distribution was measured by flow cytometry using PI. (B) The percentage of cells in G1, G2 and S phase in K562 and K562/FLM Cells without or with the treatment of flumatinib and ivermectin for 24 h.
