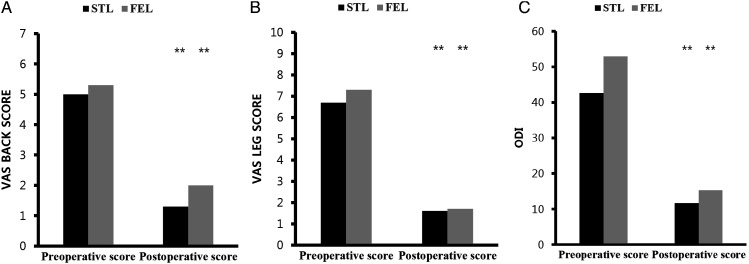
Figure 2.
Clinical status assessment. Graph showing preoperative and postoperative mean VAS back scores (A), VAS leg scores (B), and ODI scores (C) for both the STL (black) and FEL (gray) groups. Footnotes* Wilcoxon signed-rank test was used. ** Significant difference, P-value < .005. STL, subtotal laminectomy; FEL, full-endoscopic laminotomy; VAS, visual analogue scale; ODI, Oswestry Disability Index

