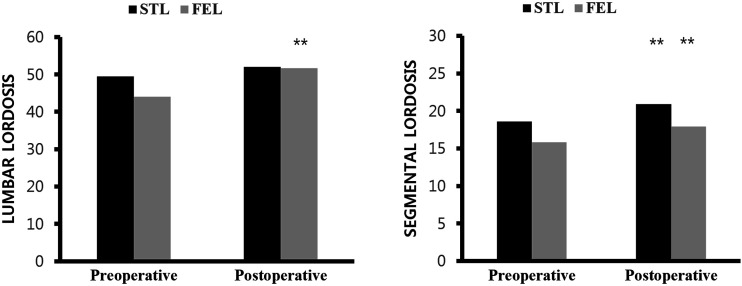
Figure 3.
Radiologic status assessment. Graph showing preoperative and postoperative mean LL (left), and SL (right) for both the STL (black) and FEL (gray) groups. Footnotes* Wilcoxon signed-rank test was used** Significant difference, p-value < 0.005.STL, subtotal laminectomy; FEL, full-endoscopic laminotomy; LL, Lumbar lordosis; SL, Segmental lordosis

