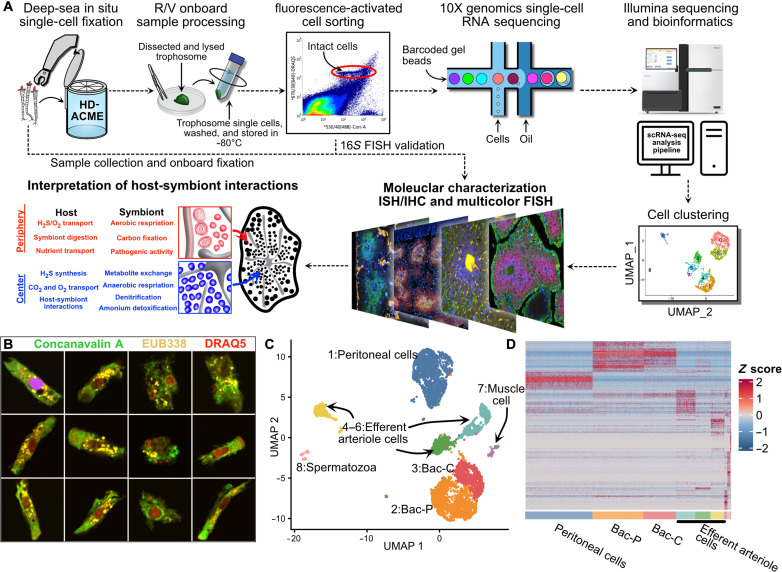
Fig. 2. Deep-sea in situ single-cell analysis of P. echinospica trophosome.
(A) Diagram showing the overall workflow of the present study. (B) FISH analysis of FACS-isolated bacteriocytes. (C) Uniform manifold approximation and projection (UMAP) of the major trophosome cell clusters. (D) Heatmap showing the expression pattern of cell cluster markers.

